What Is the Corporate Liquidity Performance Report?
- The Kyriba Corporate Liquidity Performance Report analyzes the access to liquidity for US publicly traded corporations, as an indicator of financial health to drive strategic growth.
- Kyriba analyzed quarterly data for all US publicly traded corporations with annual revenues exceeding $1 Billion USD, excluding banking institutions.
- Kyriba’s inaugural report offers a complete liquidity picture for US corporations exceeding $1 Billion in annual revenues, by reporting corporate liquidity (net of debt) and other current obligations to measure liquidity that can be mobilized and deployed in the short term.
- The report evaluates corporate liquidity by establishing the Kyriba Short-Term Liquidity (STL) Index, which normalizes short-term liquidity per billion in annual revenue.
- The purpose of the report is to study liquidity patterns across companies and industries, observe trending indicators against macroeconomic shifts and identify best practices that contribute to increased liquidity performance.

Corporate Liquidity Performance Report Overview
Corporate Liquidity Performance Report: Key Findings
- Corporate Liquidity for US corporates was $3.46 Trillion at the end of 2023, a year over year increase of $180 Billion.
- The top three industries with the greatest access to liquidity in 2023: Financials (non-bank), Information Technology and Real Estate.
- The Kyriba Short-Term Liquidity (STL) Index , a measure of variability normalized by revenue size, increased 5.0% quarter- over-quarter and 5.6% year-over year.
- Large corporations (over $50B revenue) exhibit lower and more stable STL Index ratios, while smaller ($1-5B revenue) firms have much higher and more volatile metrics.
- Industries with the greatest access to liquidity in 2023 were non-bank financials, information technology and real estate services companies.
- Corporations using Kyriba’s Liquidity Performance Platform exceed the STL Index by an average of 6%, or $12 Million per $1 Billion in annual revenue.
Total Short-Term Liquidity
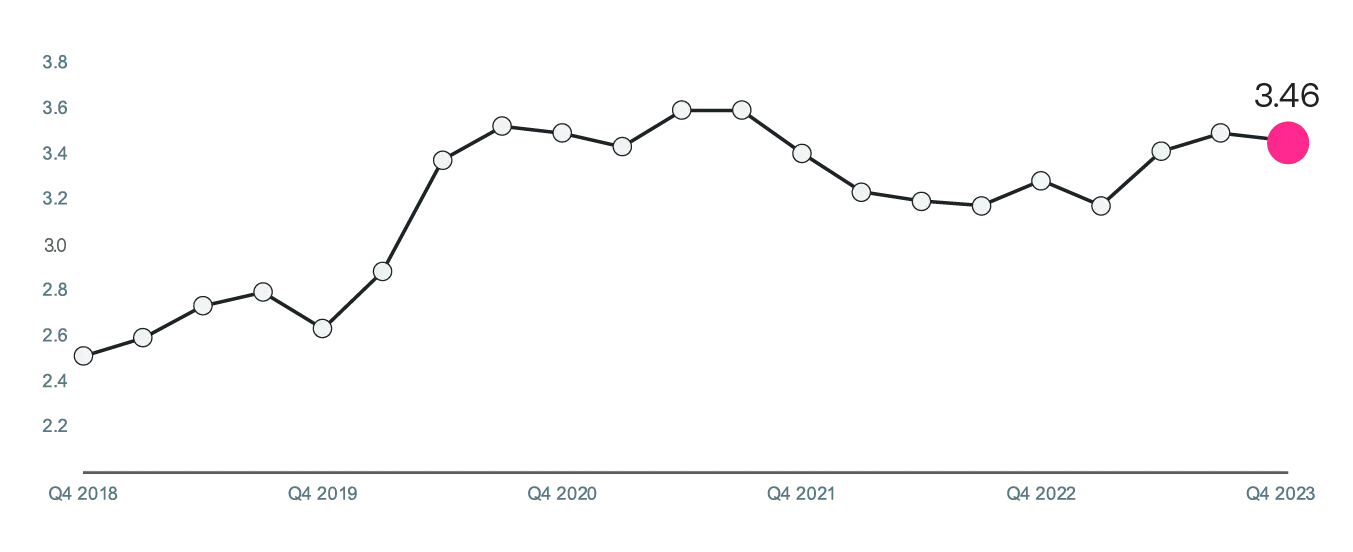
Total Short-Term Liquidity for large US corporates was $3.4 Trillion at the end of 2023, a $180 Billion increase from the end of 2022.
This shows that corporates are increasing liquidity in the face economic uncertainty, rising inflation and market volatility.
Kyriba Short-Term Liquidity Index
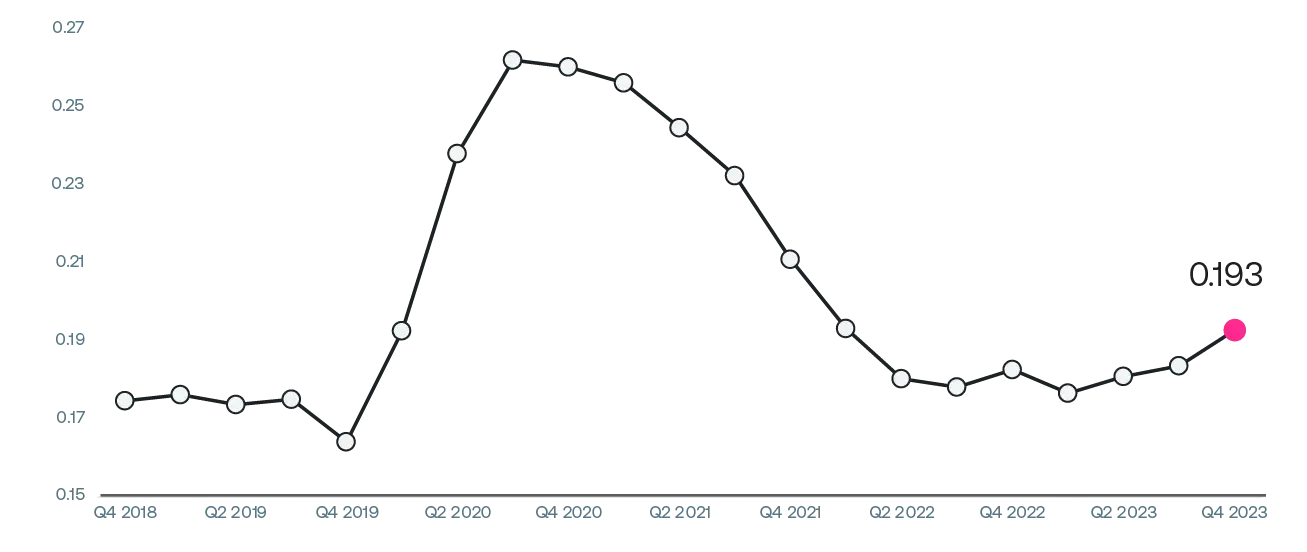
At the end of 2023, Kyriba’s Short-Term Liquidity Index, the ratio of Short Term Liquidity to Annual Revenues, reached its highest level in over two years. Short-Term Liquidity was measured at $3.46T against combined annual revenues of $17.8T at 12/31/2023.
Why this matters
The Short-Term Liquidity Index is a clear indicator of the rapid response for different sized companies to changing economic conditions in times of uncertainty.
STL/Revenue by Annual Revenue Size
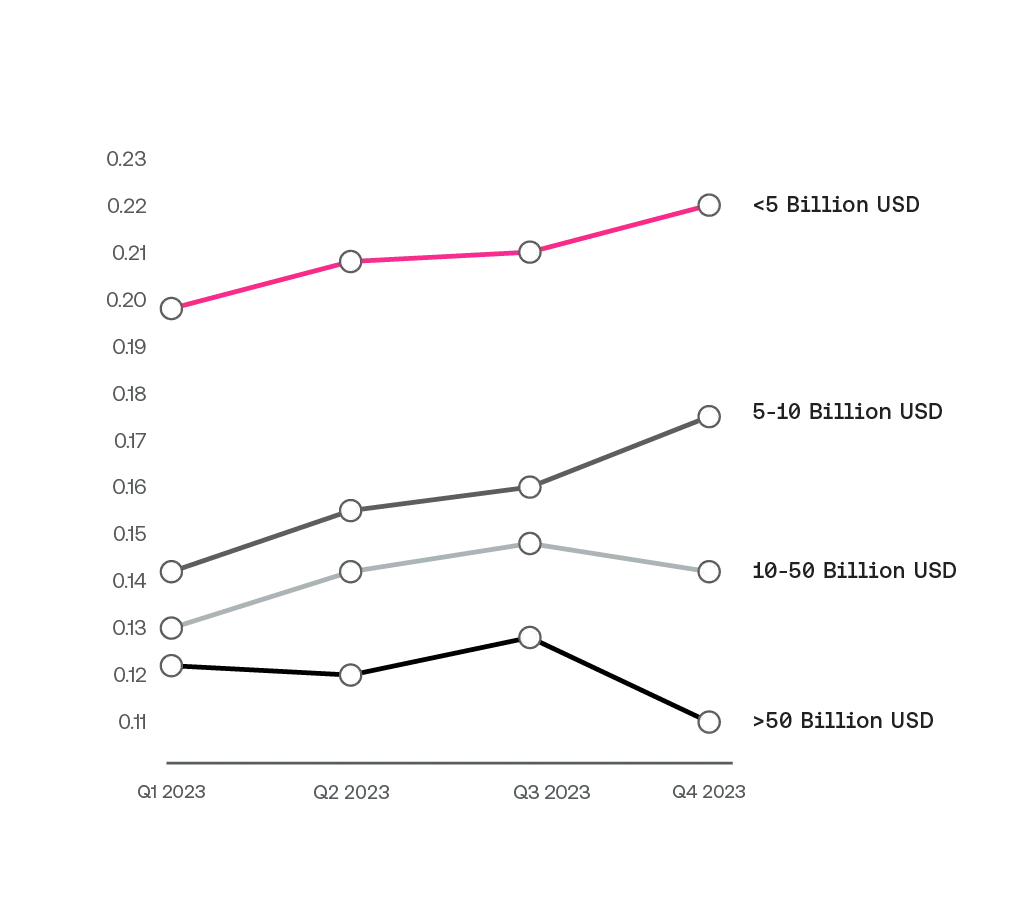
Fortune 100 corporations displayed lower access to liquidity in Q4 of 2023, while organizations between $10B and $50B and between $1B and $5B reported increased liquidity by the end of 2023.
With the exception of very large corporations, this shows that most corporations are focused on increasing access to liquidity
Industries With the Greatest Access to Liquidity
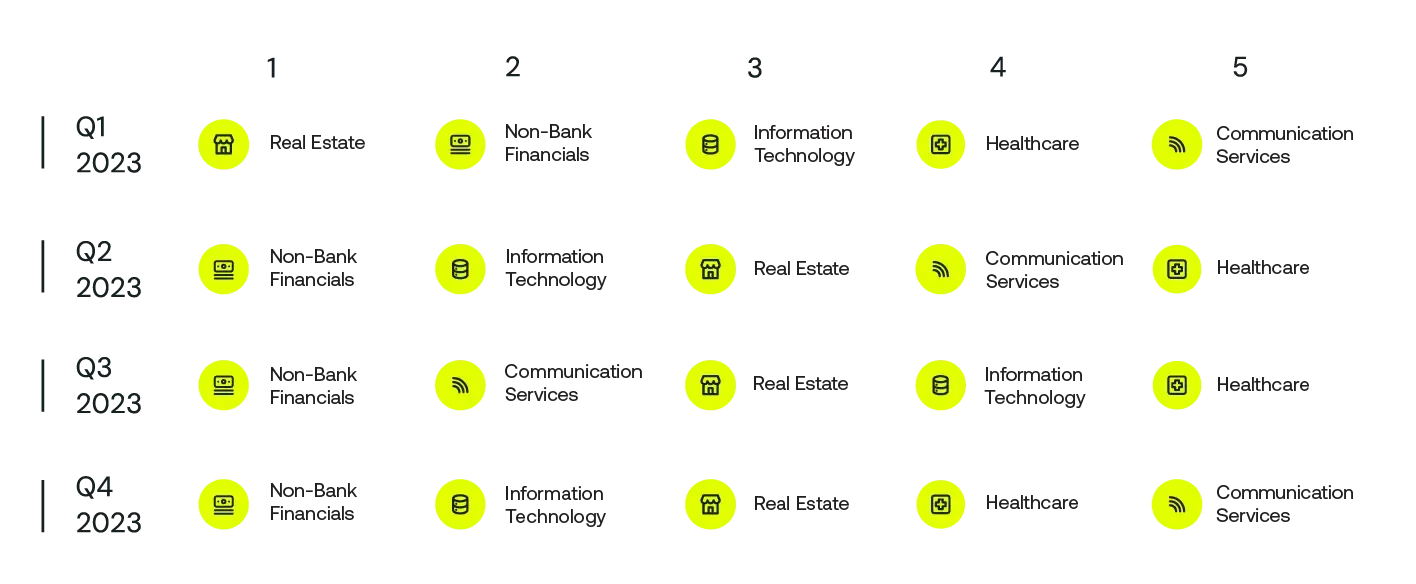
Across the board, liquidity remains a top priority but the data provides a holistic view of how industries are performing and underscores the opportunities for certain industries to be more proactive when it comes to liquidity management.
Non-Bank Financials, Information Technology and Real Estate Services continue to have the most access to liquidity, while industries such as Utilities, Consumer Staples and Energy fall short on access to liquidity.
The Kyriba Effect on Liquidity Performance
- Having created an unbiased liquidity metric based solely on publicly available financial data, Kyriba sought to understand what practices contributed to greater access to liquidity.
- Kyriba compared the Short-Term Liquidity Index for corporates using Kyriba against non-customers and the entire sample population.
- For the entire survey group and within nearly every industry sector, the 218 Kyriba clients in its study averaged greater STL Index performance - demonstrating they have greater access to liquidity than their peers by 6% or $12 Million per $1 Billion in annual revenue.
- Kyriba attributes this success to improved capabilities to connect, protect, forecast and optimize liquidity including best practices for cash forecasting, liquidity planning, in-house banking and hedging that are enabled by Kyriba’s Liquidity Performance Platform.
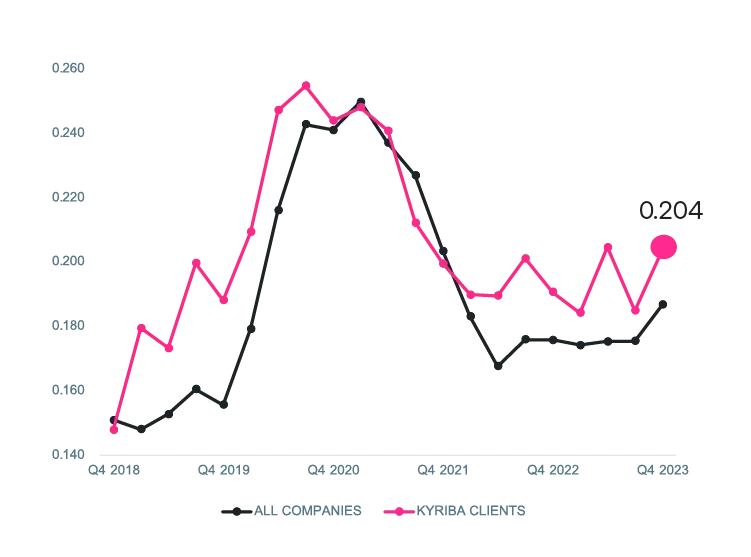
Short-Term Liquidity Index - the Kyriba Effect
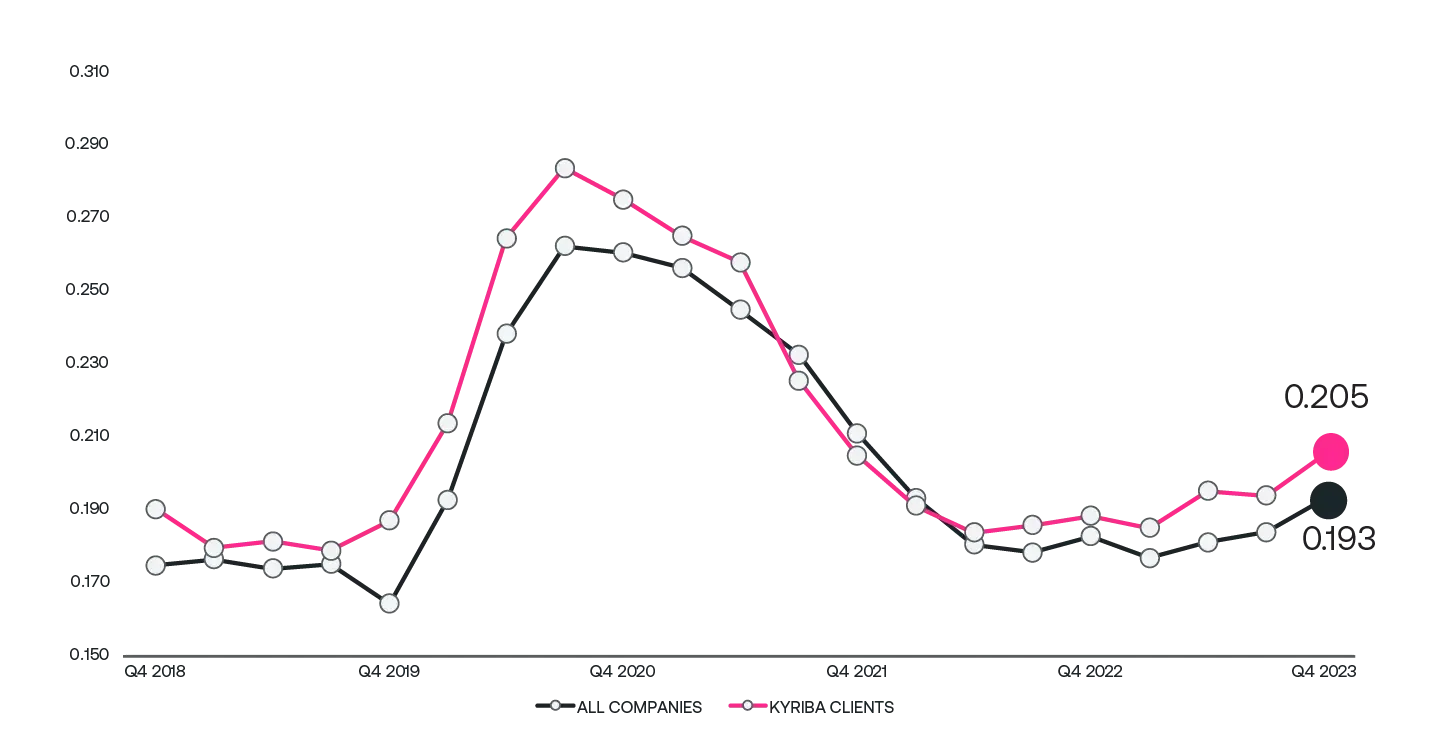
Corporates using the Kyriba platform demonstrated a 6% improvement in liquidity availability compared to all other companies in study. The increase is attributable to the implementation of liquidity performance practices.
Non-Bank Financials
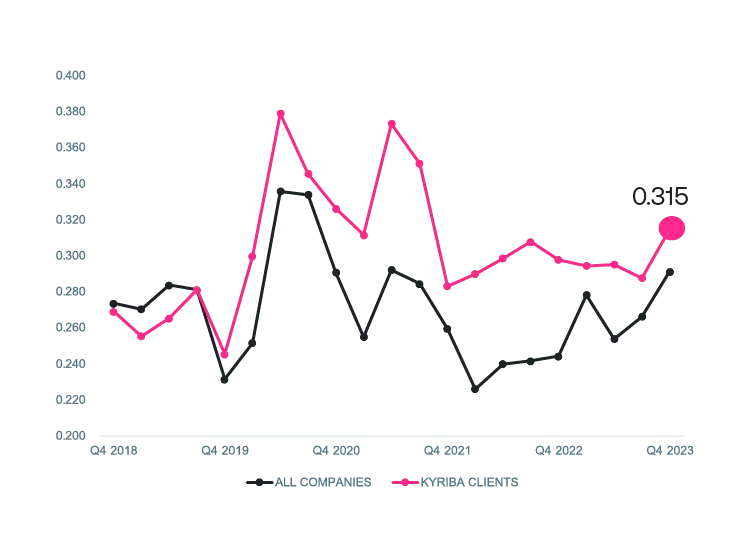
For Non-Bank Financial organizations, the Short-Term Liquidity Index improvement for Kyriba customers exceeds the industry median by $23 Million per $1 Billion of revenue since Q4 2018. Much of this is improvement is driven by the Insurance industry.
Insurance
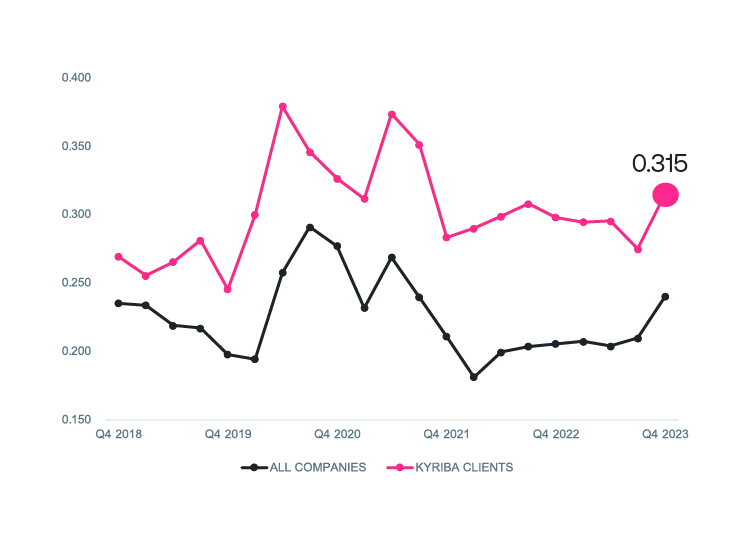
Looking specifically at insurance companies within the Non-Bank Financials sector, Kyriba clients in the Insurance Industry over the past five years exceed the median Short-Term Liquidity Index by $95 Million in additional liquidity per $1 Billion of Revenue.
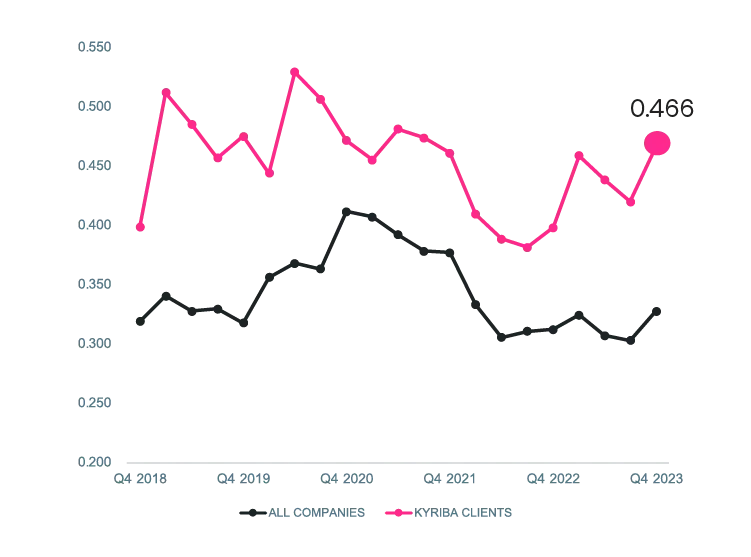
Industrial Companies
In the Industrials Sector, which make up nearly half the companies in our study, Kyriba clients outperformed the Short-Term Liquidity Index by 10.2%, or $19 Million in liquidity per $1 Billion of revenue.
Information Technology Companies
In the Information Technology Sector, Kyriba customers demonstrate greater access to liquidity compared to their peers by an average of $152 Million per $1 Billion of revenue since 2018.
Report Methodology
Kyriba’s objective was to create an index that can be calculated on a recurring basis using only publicly available data, with as few assumptions as possible.
Kyriba studied quarterly data from 2018 through the fourth quarter of 2023 for US companies that had annual revenue of at least $1 Billion USD in 2020. It
excluded banks and finance companies and entities with highly regulated capital requirements. This offered a sample size of 1,080 companies.
Short-Term Liquidity (STL) is derived from published quarterly sources and is calculated as follows:
STL = (cash equivalents & short-term investments + available credit) - (current portion of long-term debt + net interest expense)
Cash equivalents, short-term investments, available credit, and the current portion of long-term debt are based on the latest quarterly reported balance sheet values. Net interest expense is based on net interest expense for the past four quarters as an estimate of the amount of interest expense that will be incurred for the next four quarters.
The Kyriba STL Index was further created to compare liquidity across companies of varying sizes. The STL Index normalizes STL among companies by dividing STL by Revenue, where Revenue for this calculation is defined as the quarterly reported revenue for the past four quarters.
Kyriba believes the STL Index to be a valid measure of rapid response to changes in economic conditions and best practices.
About Kyriba Corp.
Kyriba is a global leader in liquidity performance that empowers CFOs, Treasurers and IT leaders to connect, protect, forecast and optimize their liquidity. As a secure and scalable SaaS solution, Kyriba brings intelligence and financial automation that enables companies and banks of all sizes to improve their financial performance and increase operational efficiency. Kyriba’s real-time data and AI-empowered tools empower its close to 3,000 customers worldwide to quantify exposures, project cash and liquidity, and take action to protect balance sheets, income statements and cash flows. Kyriba manages more than 3 billion bank transactions and $15 trillion in payments annually and gives customers complete visibility and actionability, so they can optimize and fully harness liquidity across the enterprise and outperform their business strategy.