Research
2022 Non-Banking Financial Institutions (NBFI) Survey Results

Table of Contents
- Executive Summary
- Disbursement Preferences: Staff, Technology, and Then Structure
- Highest Priorities: Security, Compliance, Efficiency
- Benchmarking — Achieving a Personal Best
- Key Finding Analysis
- 1. Heavy Users of Accounts
- DESCRIPTION OF ACCOUNT TYPES:
- 2. Disbursement Preferences: Staff, Technology, & Then Structure
- DESCRIPTION OF ACCOUNT TYPES:
- 3. INSURANCE COMPANY. Insurance Liquidity Concentration, & Aggregation Techniques
- DESCRIPTION OF ACCOUNT TYPES:
- 4. Non-Insurance NBFIs Have More Waterfall Payments than Insurance Companies
- DESCRIPTION OF ACCOUNT TYPES:
- 5. Highest Priorities: Security, Compliance, Efficiency
- ADDITIONAL DISCUSSION:
- 6. Payment Controls Are a Continuum of High to Low Adoption. Fastest Expected Growth: AI/ML
- ADDITIONAL DISCUSSION:
- 7. Measurements: Financial Performance Wins Over SLA
- ADDITIONAL DISCUSSION:
- 8. Benchmarks — Personal Best
- ADDITIONAL DISCUSSION:
- 9. Collateral Management: The Most Common Manager Is…Treasury
- 10. Collateral Management’s Impact on Cash Positioning: Tracked Separately.
- ADDITIONAL DISCUSSION:
Executive Summary
Thank you for reading this edition of the Non-Banking Financial Institution (NBFI) Survey. This survey was underwritten by Kyriba for the 2nd year in a row as they continue to serve an increasing number of companies in these industries. This survey and the report were written and produced by Strategic Treasurer. The previous iteration of this survey focused solely on insurance companies, but by expanding this research in 2022 to related industry verticals, we have been able to capture a greater breadth of “treasury intensive” financial companies.
The majority of survey respondents were headquartered in North America (Canada, United States, Mexico), with European companies representing the next highest level of coverage. Asia-Pacific headquartered firms made up 4% of respondents.
With this year’s research, we sought to better understand the priorities, plans, and activities that financial institutions were focused on. The results didn’t disappoint. You are invited to read through the top ten items from the research and see what is dramatic and notable, as well as what hasn’t changed much. We learn from each of these situations, and knowing what others are doing informs our thinking and may help adjust our priorities.
Disbursement Preferences: Staff, Technology, and Then Structure
NBFIs are centralizing their staff and using specialized payment technology most heavily. However, the use of pay-on-behalf-of (POBO) structures is in the early stages of adoption while showing strong signs of likely growth.
Highest Priorities: Security, Compliance, Efficiency
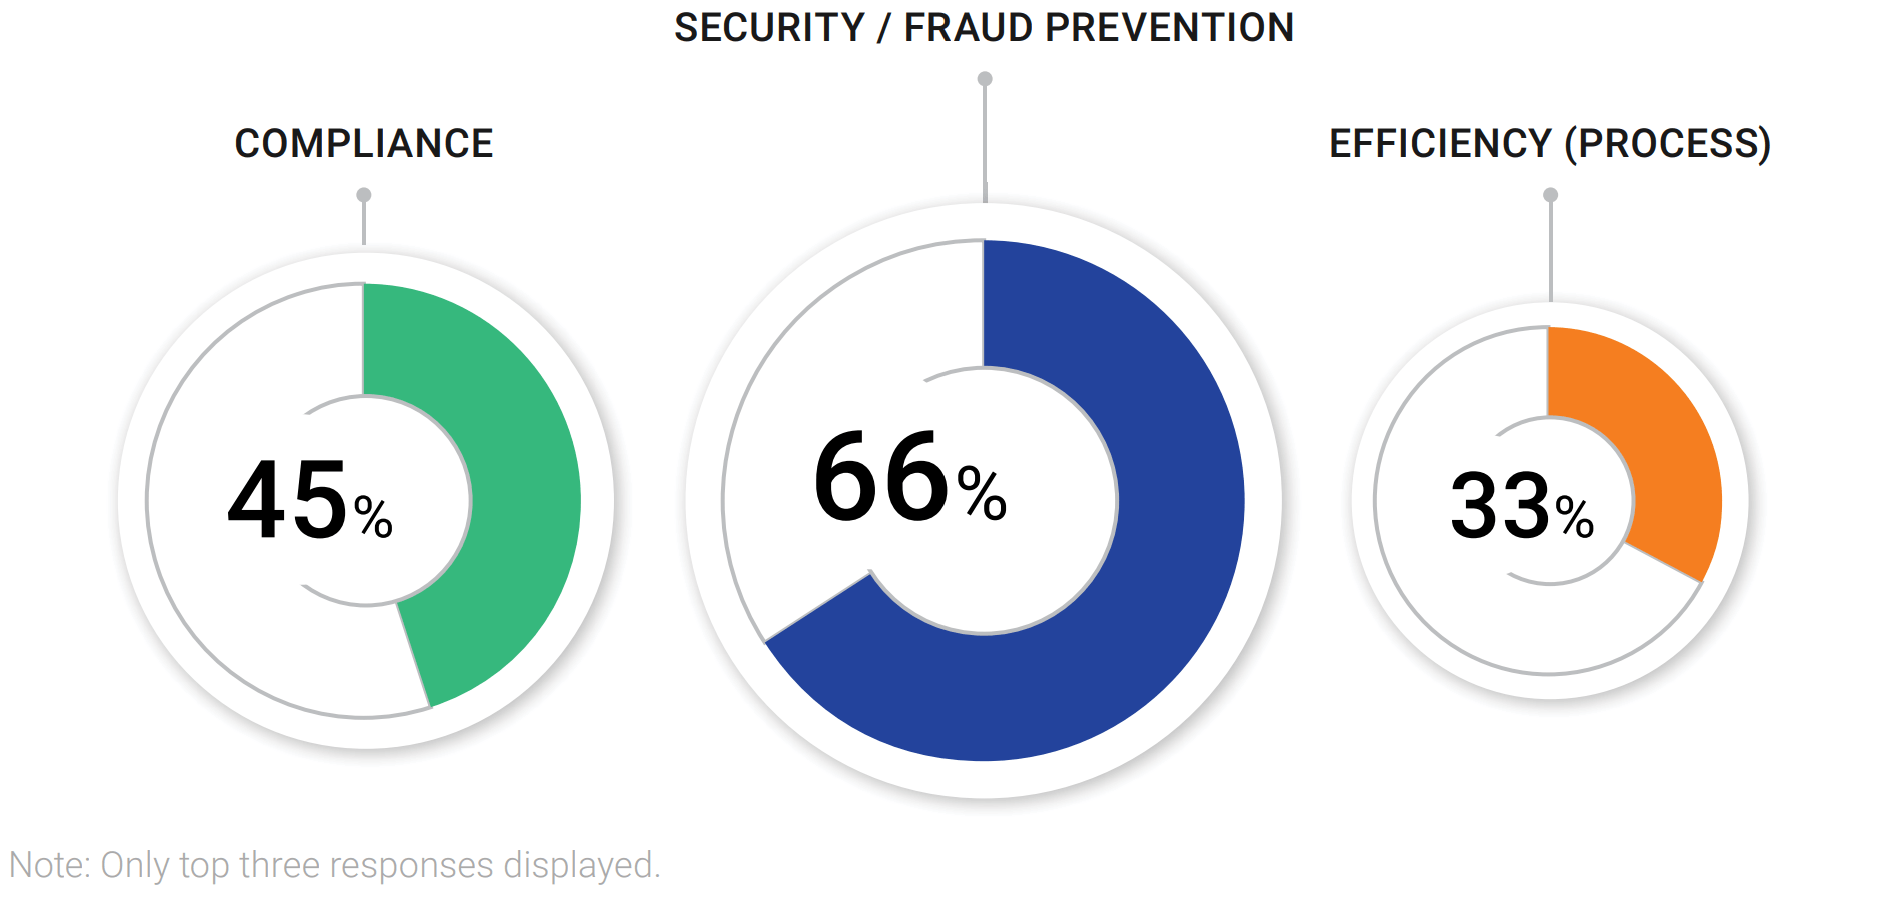
NBFIs face numerous competing demands, and security/fraud prevention (66%) dominates all other priorities, including compliance (45%). Efficiency matters too in a more limited measure.
Benchmarking — Achieving a Personal Best
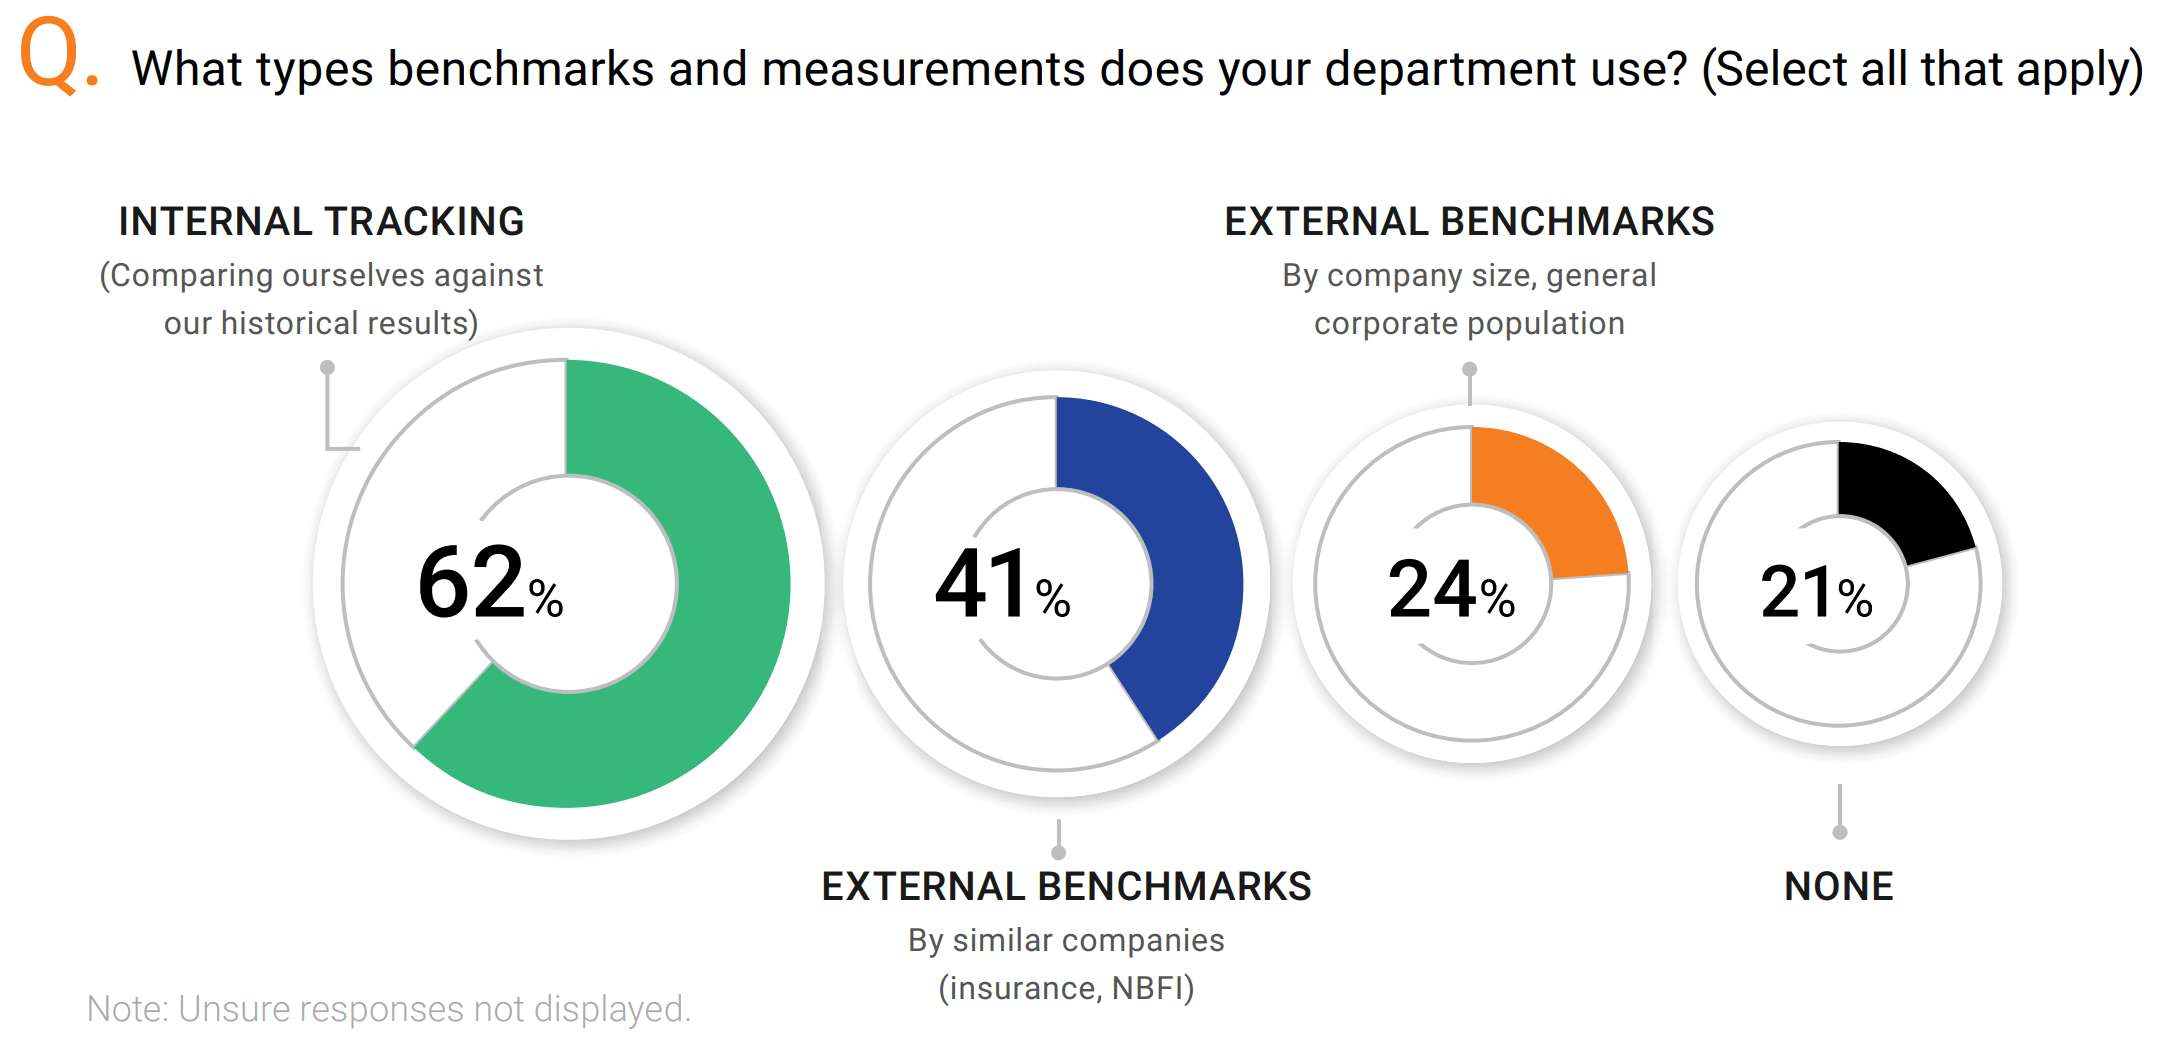
What are companies measuring? They are most frequently tracking their current performance against their own historical numbers (62%), while a minority of firms currently perform external benchmarking: 41% against similar company types, and 24% against companies of the same size or complexity.
Thank you for taking the time to read through this report. For those who invested the time to take the moderate-length survey, you have our deep appreciation. You are helping out this vital industry. Your input allows us to understand what is happening and what professionals are thinking and doing in the NBFI space. As always, those who take the survey receive more information and details from the research. It is one additional way of thanking you for your time.
Key Finding Analysis
1. Heavy Users of Accounts
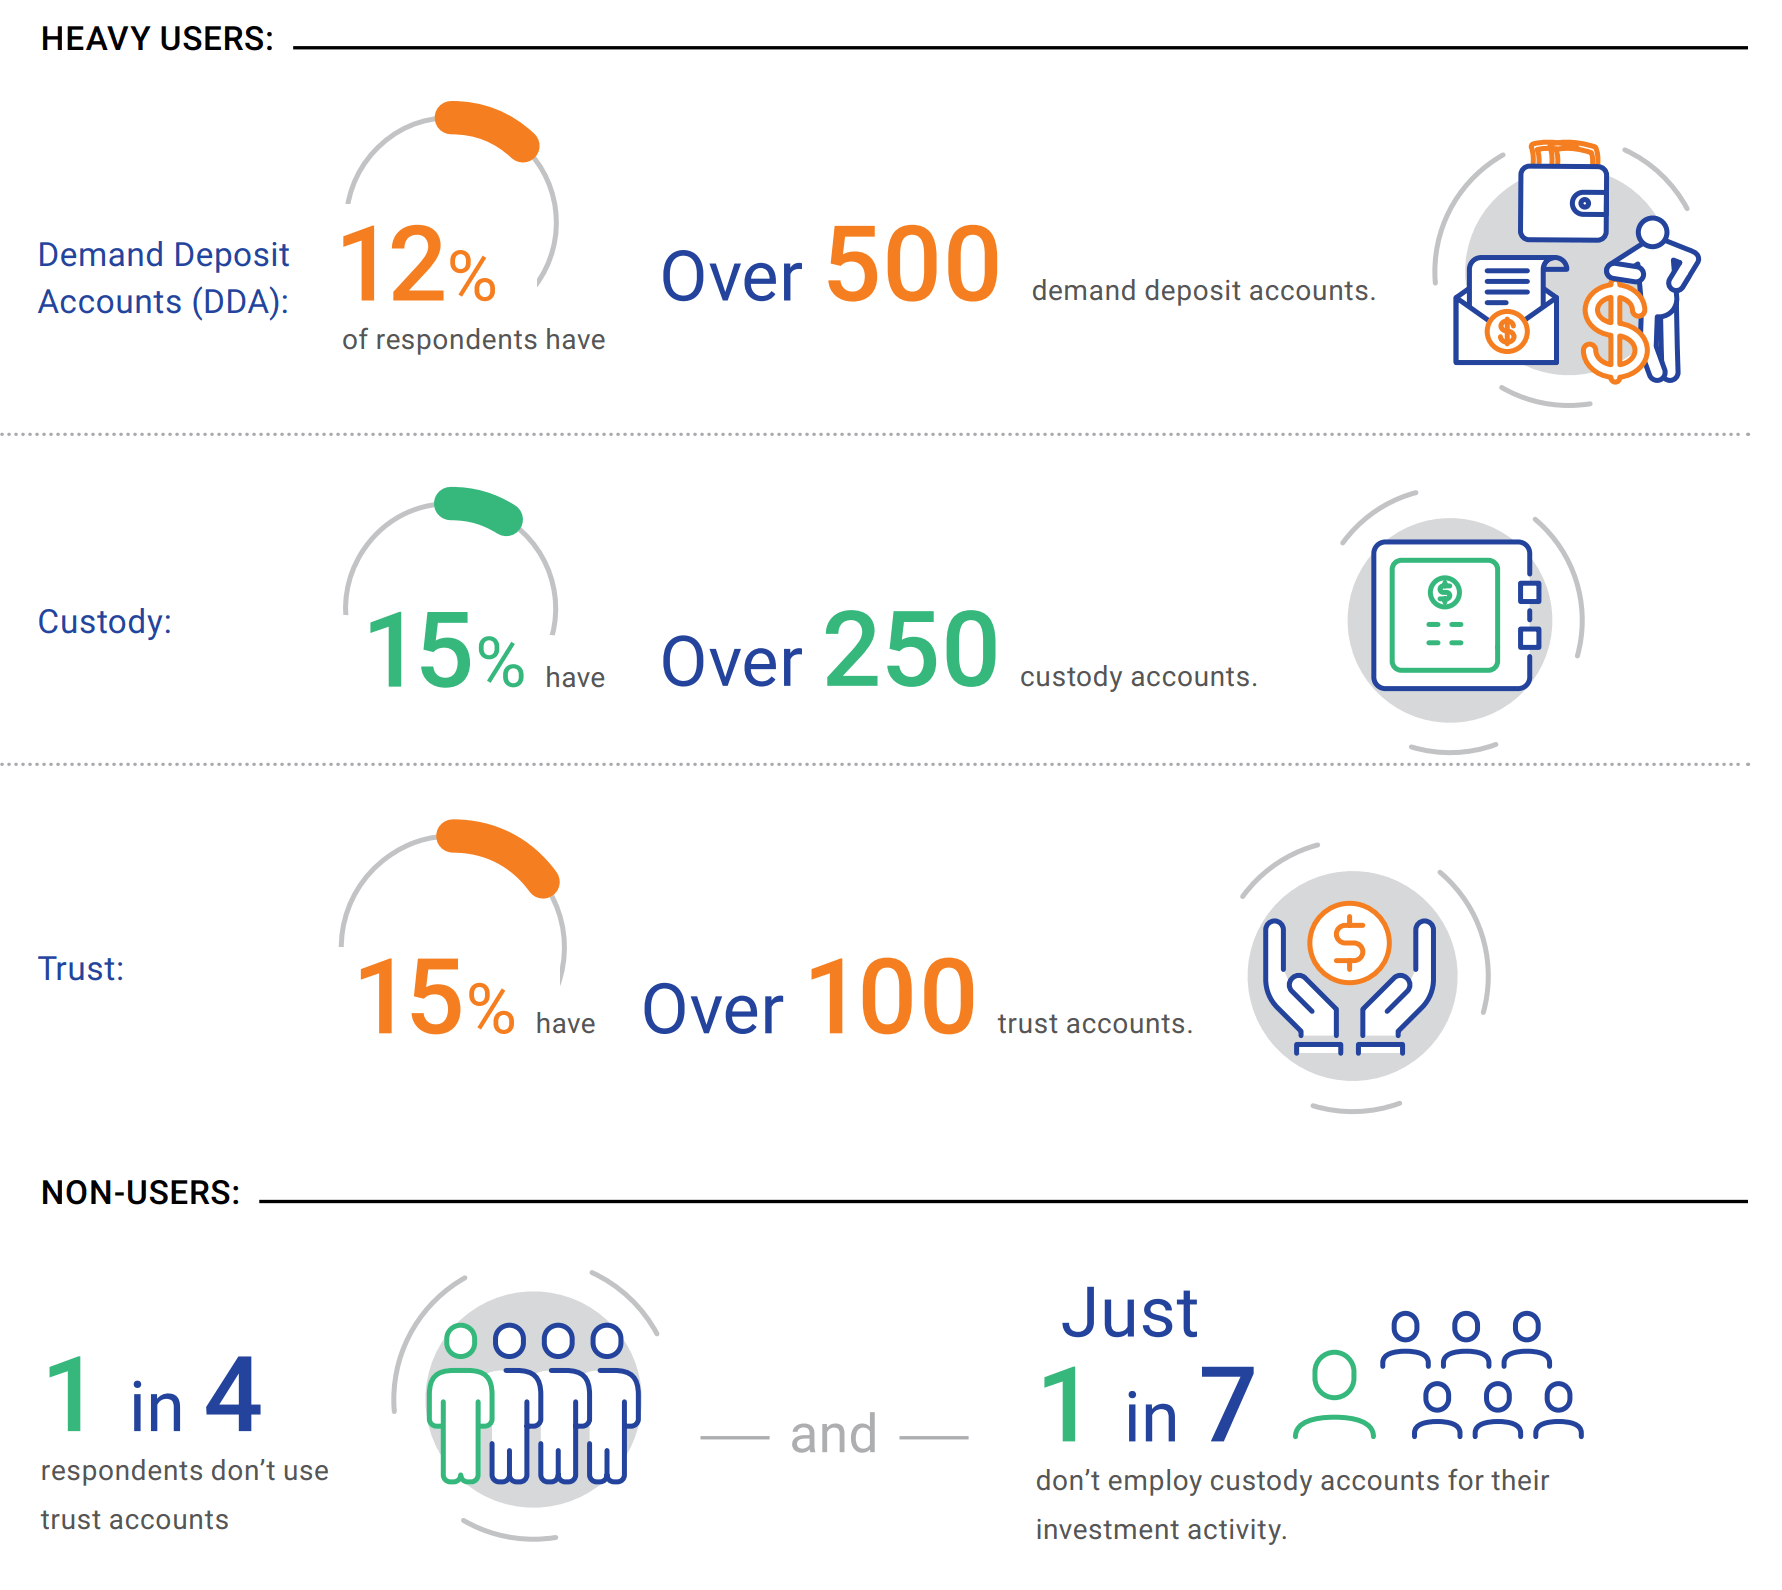
The NBFI world uses multiple account types, and a notable minority have a high volume of accounts. These accounts cover operating activity (in this survey, we use the term “demand deposit accounts” or DDA), investment activity (custody accounts), and trust accounts (trust).
DESCRIPTION OF ACCOUNT TYPES:
- Demand deposit accounts and current accounts: These are transactional accounts at the organization’s operating bank. Various deposits and disbursements flow in and out of these accounts, and cash is held in them.
- Custody accounts: These are accounts at custodial banks that hold investments/securities for the organization making investments. Securities are held in these accounts.
- Trust accounts: These are accounts that are managed by a trustee (typically a bank) on behalf of a third party. Activity running through these accounts is approved and executed by the trustee based upon valid and appropriate instructions.
2. Disbursement Preferences: Staff, Technology, & Then Structure
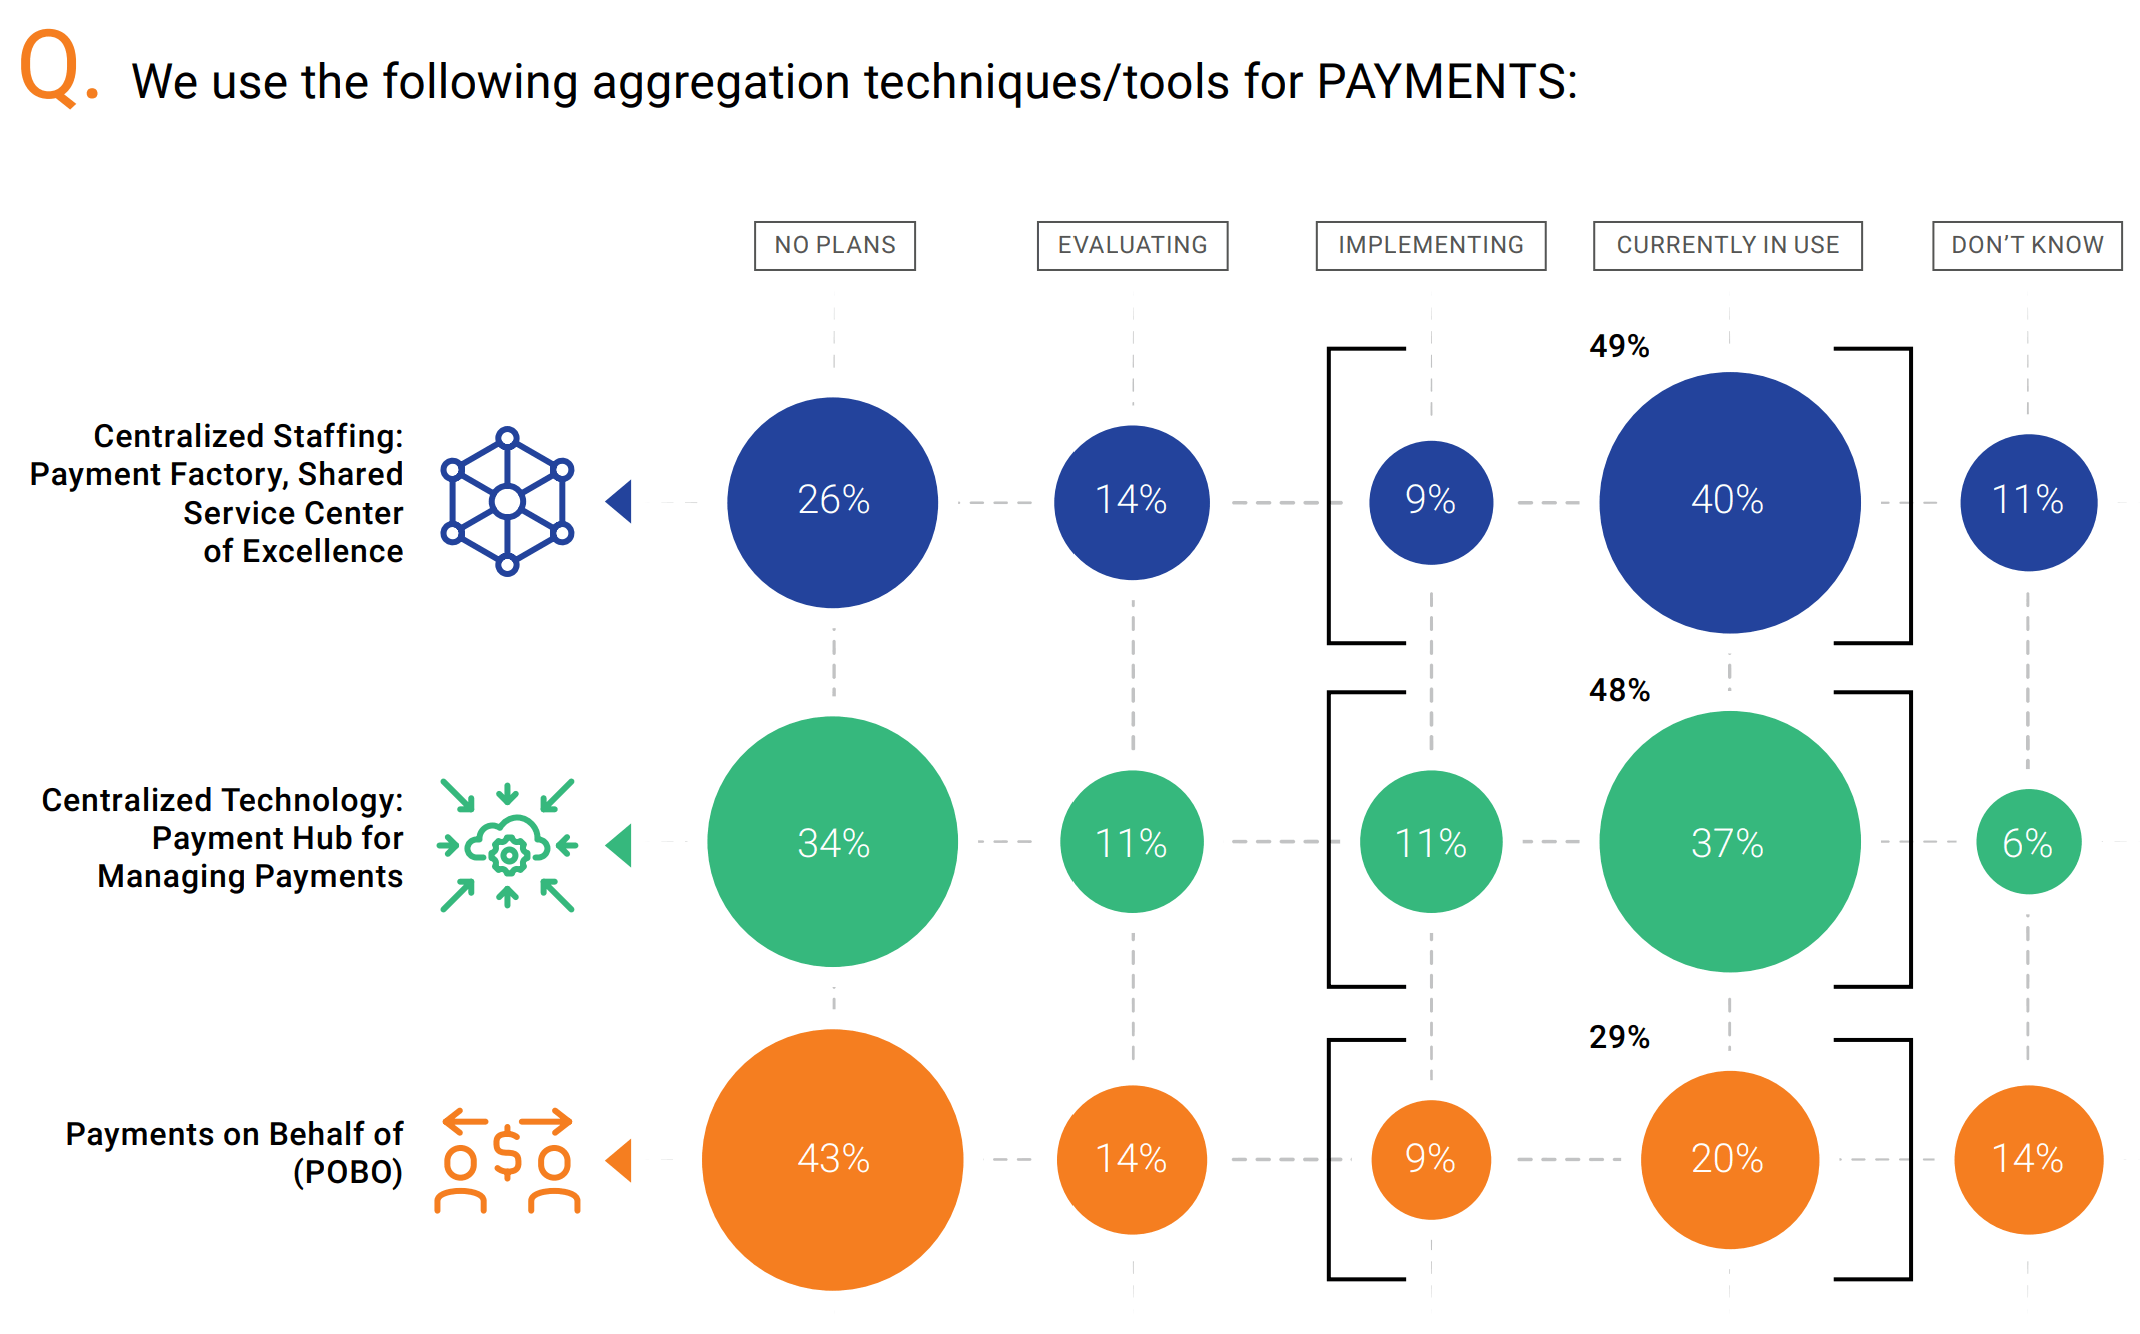
How are NBFIs organizing their staff, leveraging technology, and using payment structures? The use of “centralized staff” (payment factory or shared service center) and “centralized technology” are both likely to achieve majority status shortly. POBO looks to continue its strong growth and is expected to achieve a one-third adoption level within a few years.
- Centralized staff: Service centers (49%) are the most used option (amount in use or being implemented).
- Specialized technology: Payment hub technology is highly popular, with 48% using or implementing these tools, and another 11% indicating that they are evaluating the use of this technology.
- Payment structure (POBO): The pay-on-behalf-of structure is in use or being implemented by 29%, with another 14% evaluating it.
DESCRIPTION OF ACCOUNT TYPES:
- Centralized staff: This refers to a shared service center or center of excellence that handles the operational activity for, in this case, disbursement activity. These can be either regionalized or centralized on a global basis.
- Specialized technology: A payment hub is a common name for the technology that can support all aspects of payments. This is a system or service that allows for 1) an approval process for payments, 2) data transformation, or putting payment instructions into the proper format, 3) operational management, delivering and confirming payment information to the right payment rail or messaging platform, and 4) other services: security, validation, confirmation, etc.
- Payment structure (POBO): The pay-on-behalf-of structure allows a company with many subsidiaries or affiliates to
use a single structure for disbursements. This structure may be a separate entity that is created for this purpose or may be an existing entity. The disbursements are routed through this POBO structure, and the individual entities/companies transfer the value of the payments and the related liabilities to that entity for processing and management. Instead of having 10 disbursement accounts with 10 similar processes, this is collapsed into one for efficiency of capital and time purposes.
3. INSURANCE COMPANY. Insurance Liquidity Concentration, & Aggregation Techniques
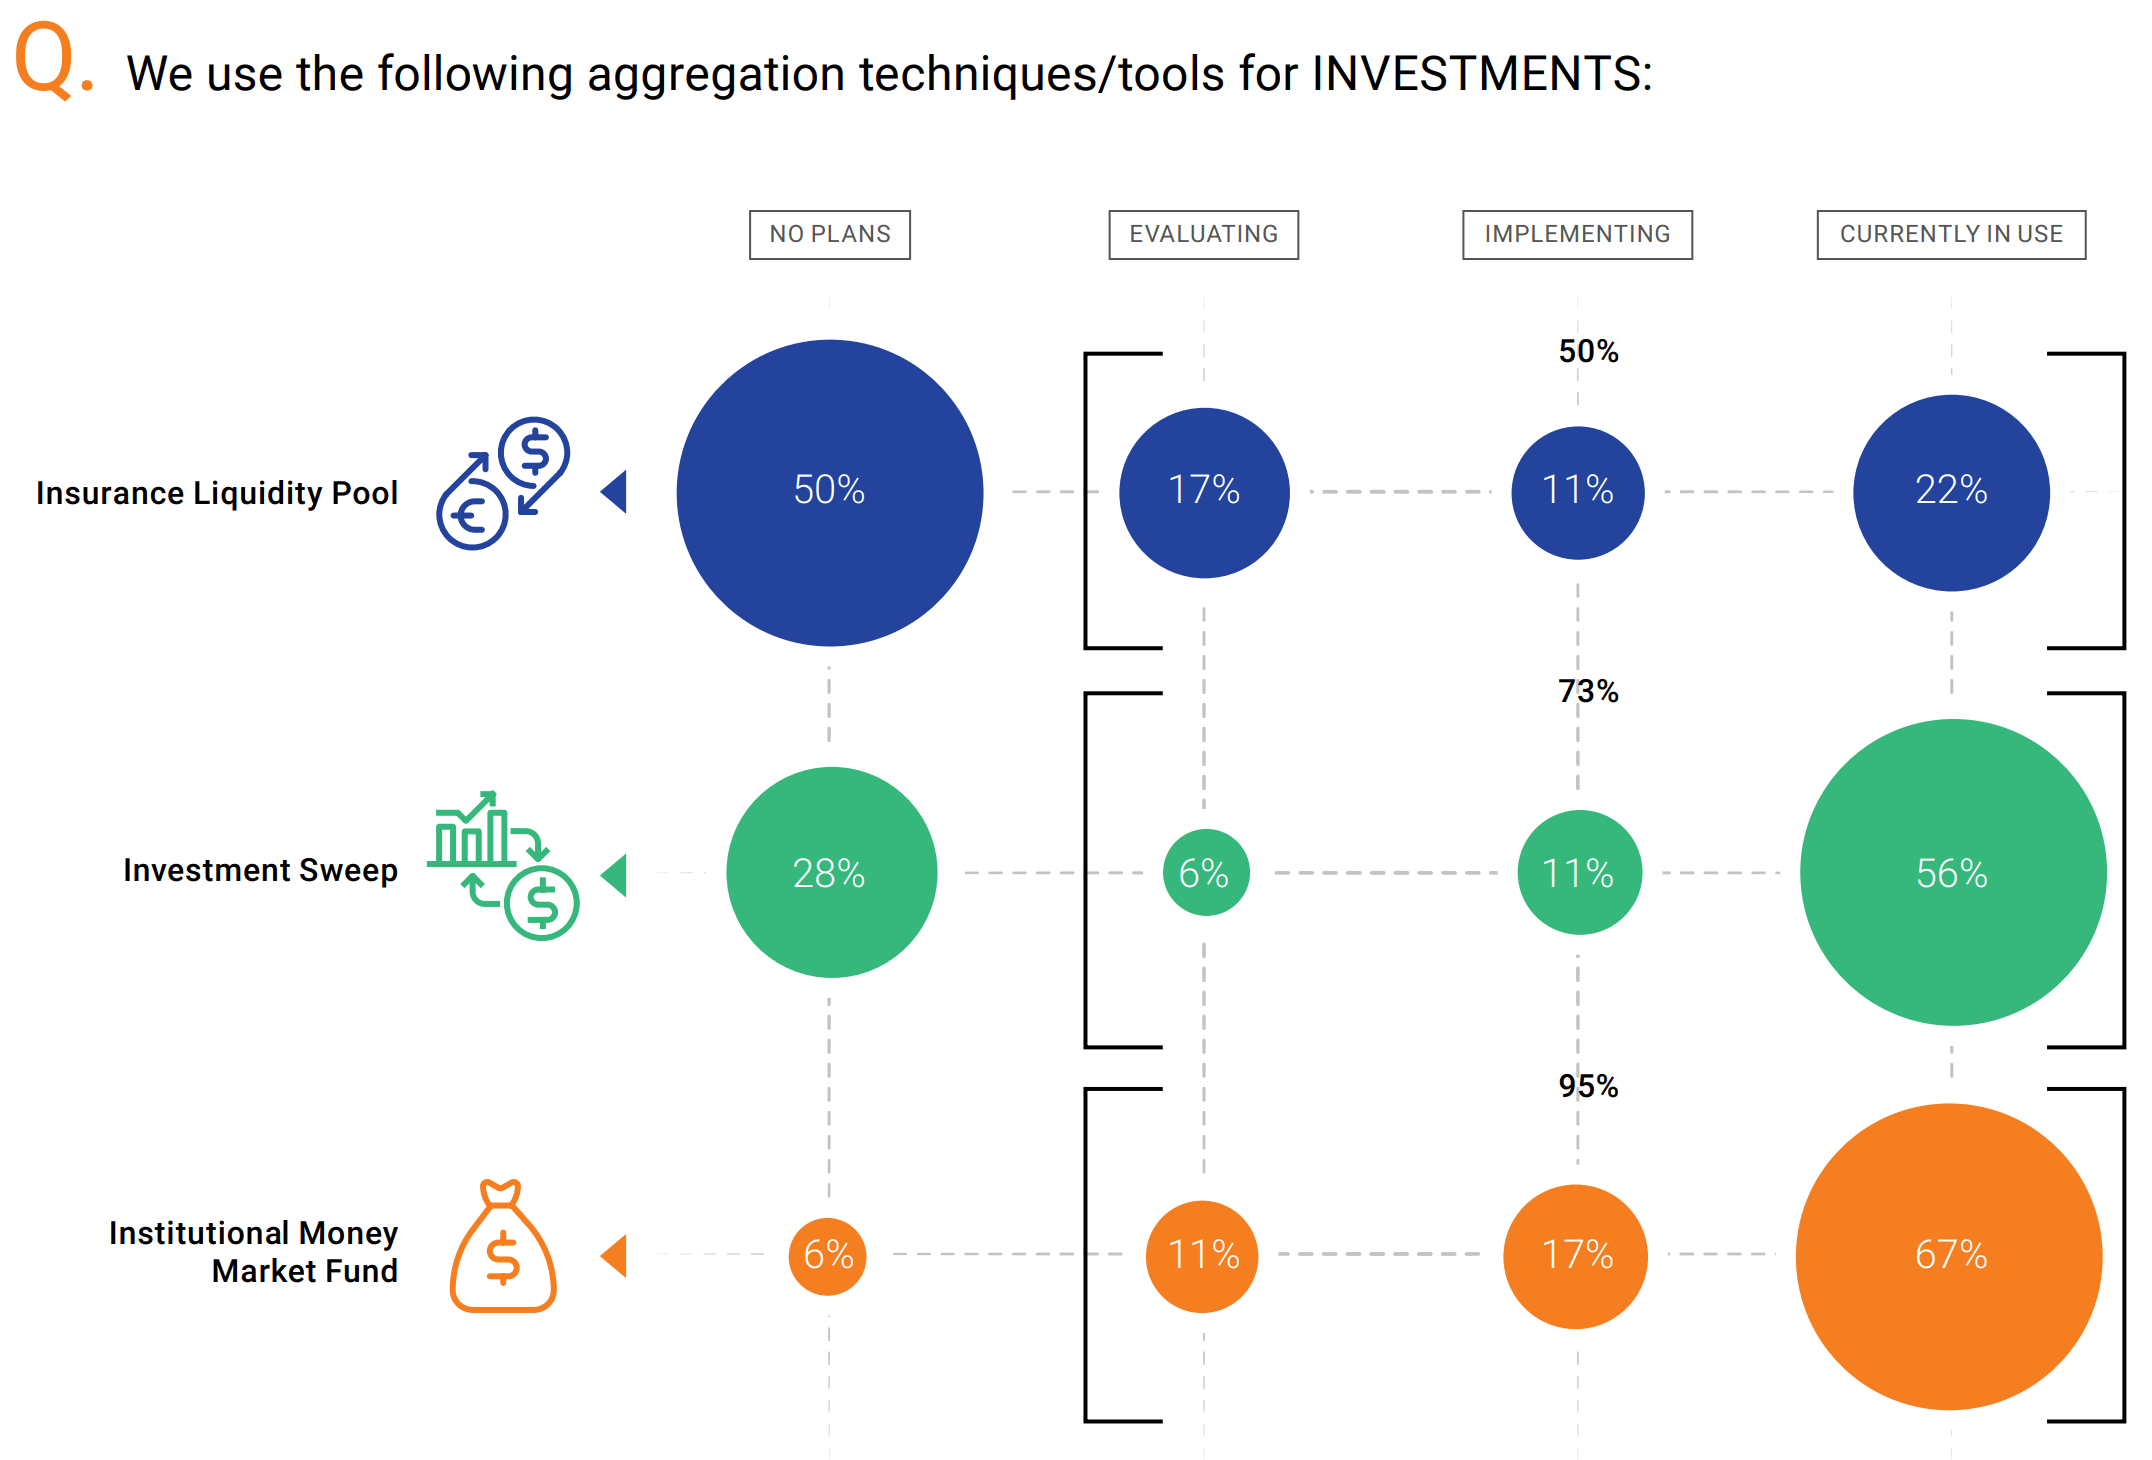
Institutional money market funds (MMF) are the most common tool for aggregating investment balances among insurance companies. Sweep mechanisms are used by over half of insurance companies and represent an easy way of automatically ensuring all cash is invested. Notably, only 2 out of 9 companies are using insurance liquidity pools currently. This service allows for consolidated investing and segmented tracking for the participants in the insurance liquidity pool. When we combine the responses for currently in use, implementing, and evaluating, the numbers stack up as follows:
- Insurance liquidity pool: 50%. (Currently in use: 22%.)
- Investment sweep: 73%. (Currently in use: 56%.)
- Institutional MMF: 95%. (Currently in use: 67%.)
DESCRIPTION OF ACCOUNT TYPES:
- Insurance liquidity pool: Primarily in the United States, insurance companies may have the options of establishing their own investment pools that support multiple companies and investment portfolios. The company can combine shorter-term funds from multiple portfolios and insurance activity and invest them in larger blocks. This reduces the number of trades and effort while allowing the individual portfolio managers to have greater liquidity while earning higher rates. Individual ownership is tracked. There are specific rules that must be followed. Many companies refer to their liquidity pool or pools as “STIP” for “short-term investment pool.”
- Investment sweep: Excess cash left in operating accounts or investment accounts is moved to an investment fund automatically. The excess funds are “swept” into an investment account and in many cases are returned the next day
automatically
4. Non-Insurance NBFIs Have More Waterfall Payments than Insurance Companies
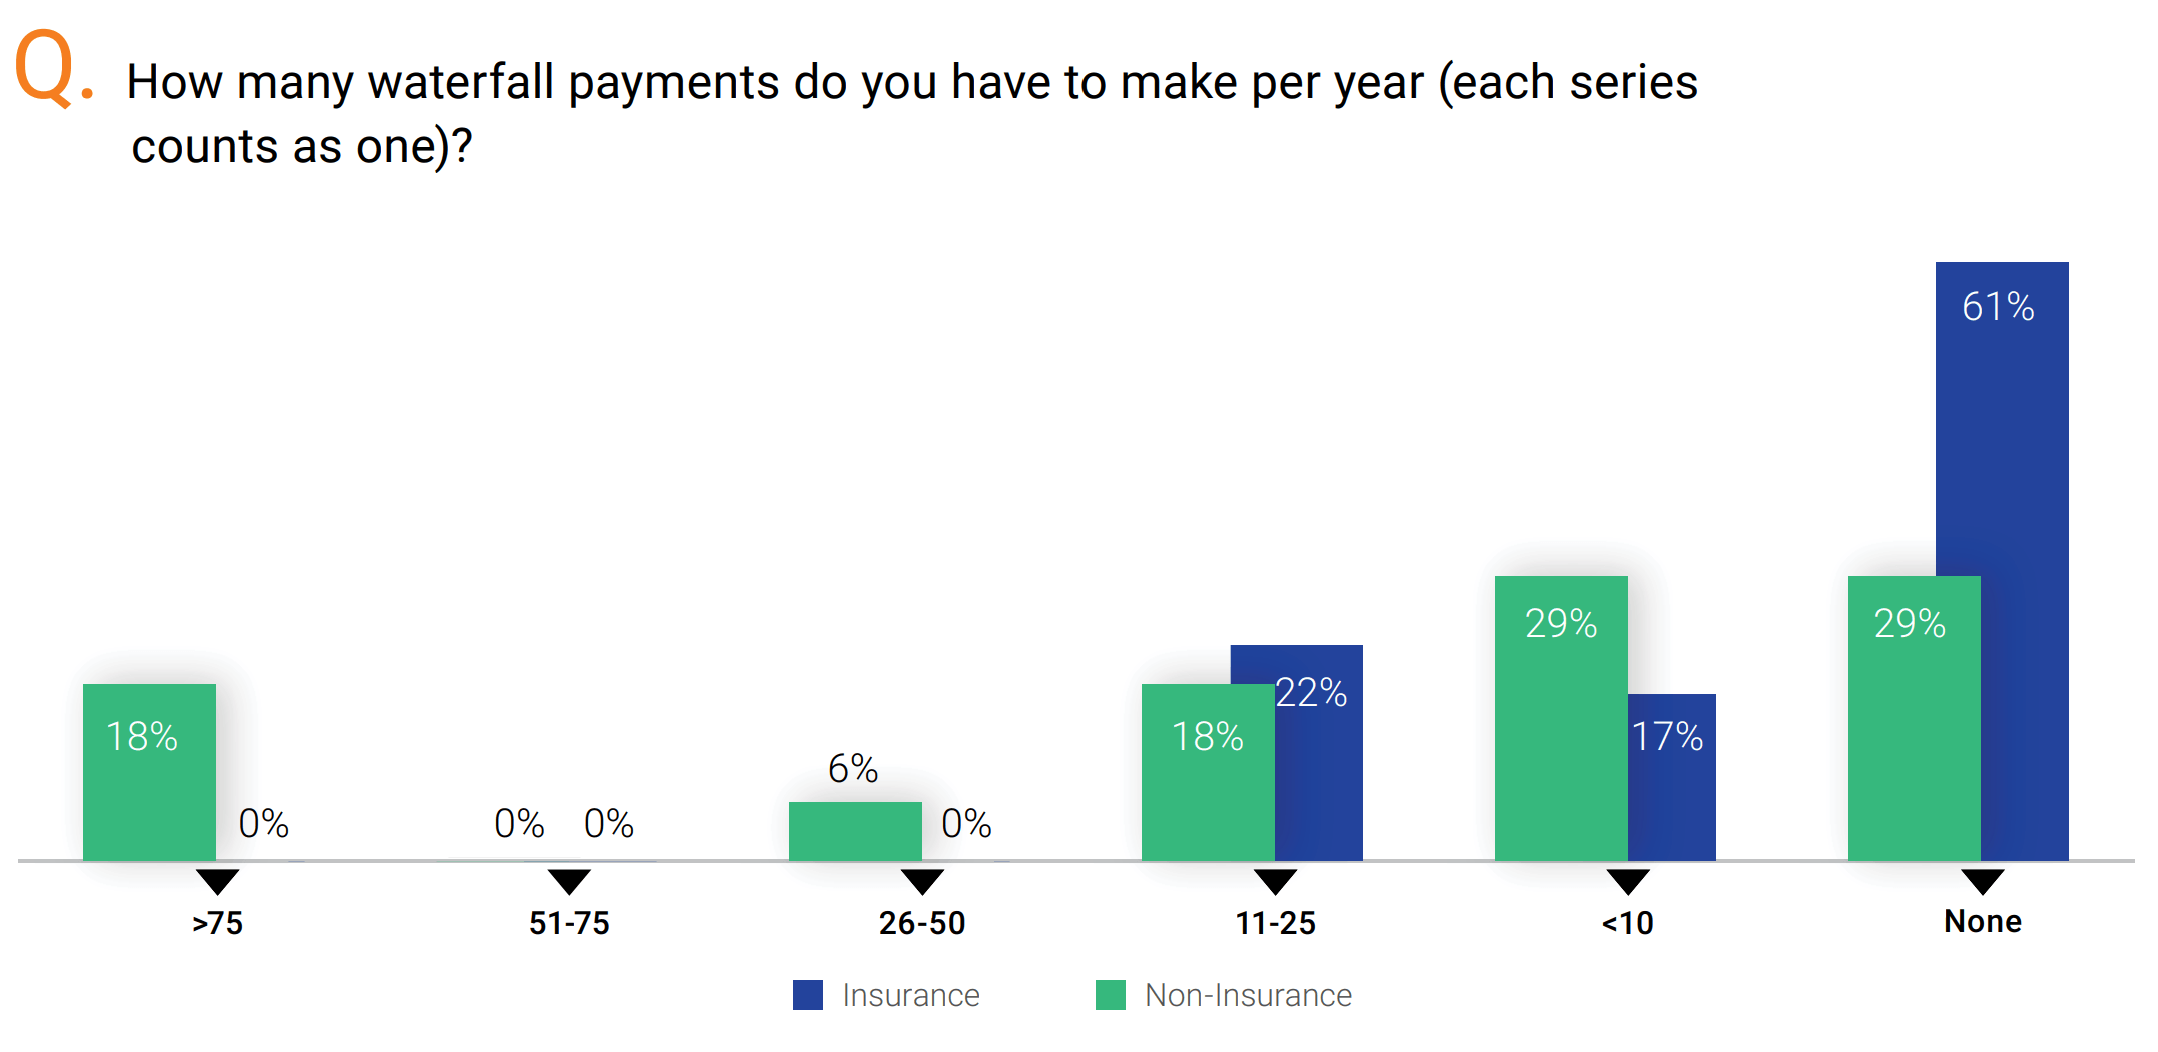
One-third of NBFIs overall generate 11 or more waterfall payment series each year. Nearly half (46%) do not have any. Stratifying the respondents between insurance companies from the rest of the NBFIs shows that the use of waterfall payments among insurance companies is roughly half of other NBFIs:
-
- Insurance companies:
− 22% have 11 or more each year.
− Majority (61%) do not have any waterfall payments in a year. - Non-insurance company NBFIs:
− 42% have 11 or more each year.
− 29% do not have any waterfall payments in a year
- Insurance companies:
DESCRIPTION OF ACCOUNT TYPES:
- Waterfall payments: There are multiple situations where an investment arrangement requires payments to be made to an entity that is at the top or middle of an entity hierarchy. Payments made to the first entity are then cascaded down through other entities until everything is completed. This cascading is referred to as a “waterfall payment,” and typically these payments flow downstream on the same date.
5. Highest Priorities: Security, Compliance, Efficiency
NBFIs face numerous competing demands. Priorities help determine the emphasis and order for which activities and initiatives are staffed, funded, and completed. For this question, seven options were provided for respondents to rank in order of priority. Looking at what respondents ranked 1st and 2nd for highest priorities, it was clear that there seems to be a strong consensus about the top of the house.
ADDITIONAL DISCUSSION:
- Willie Sutton is famous for his response to the question of why he robbed banks: “That is where the money is.” We could imagine the corollary in response to this in a similar question-answer style: “Why are you (NBFIs) focused on security/fraud prevention?” “Because there are many more Willie Suttons out there with far more automation and sophisticated tools trying to rob us.”
- Compliance is always a top priority for regulated businesses like most NBFIs. Fines, fees, and reputational damage are some of the key motivators. Only security/fraud tops compliance. Is this due to the cost and reputational damage being an even higher concern for NBFIs?
6. Payment Controls Are a Continuum of High to Low Adoption. Fastest Expected Growth: AI/ML
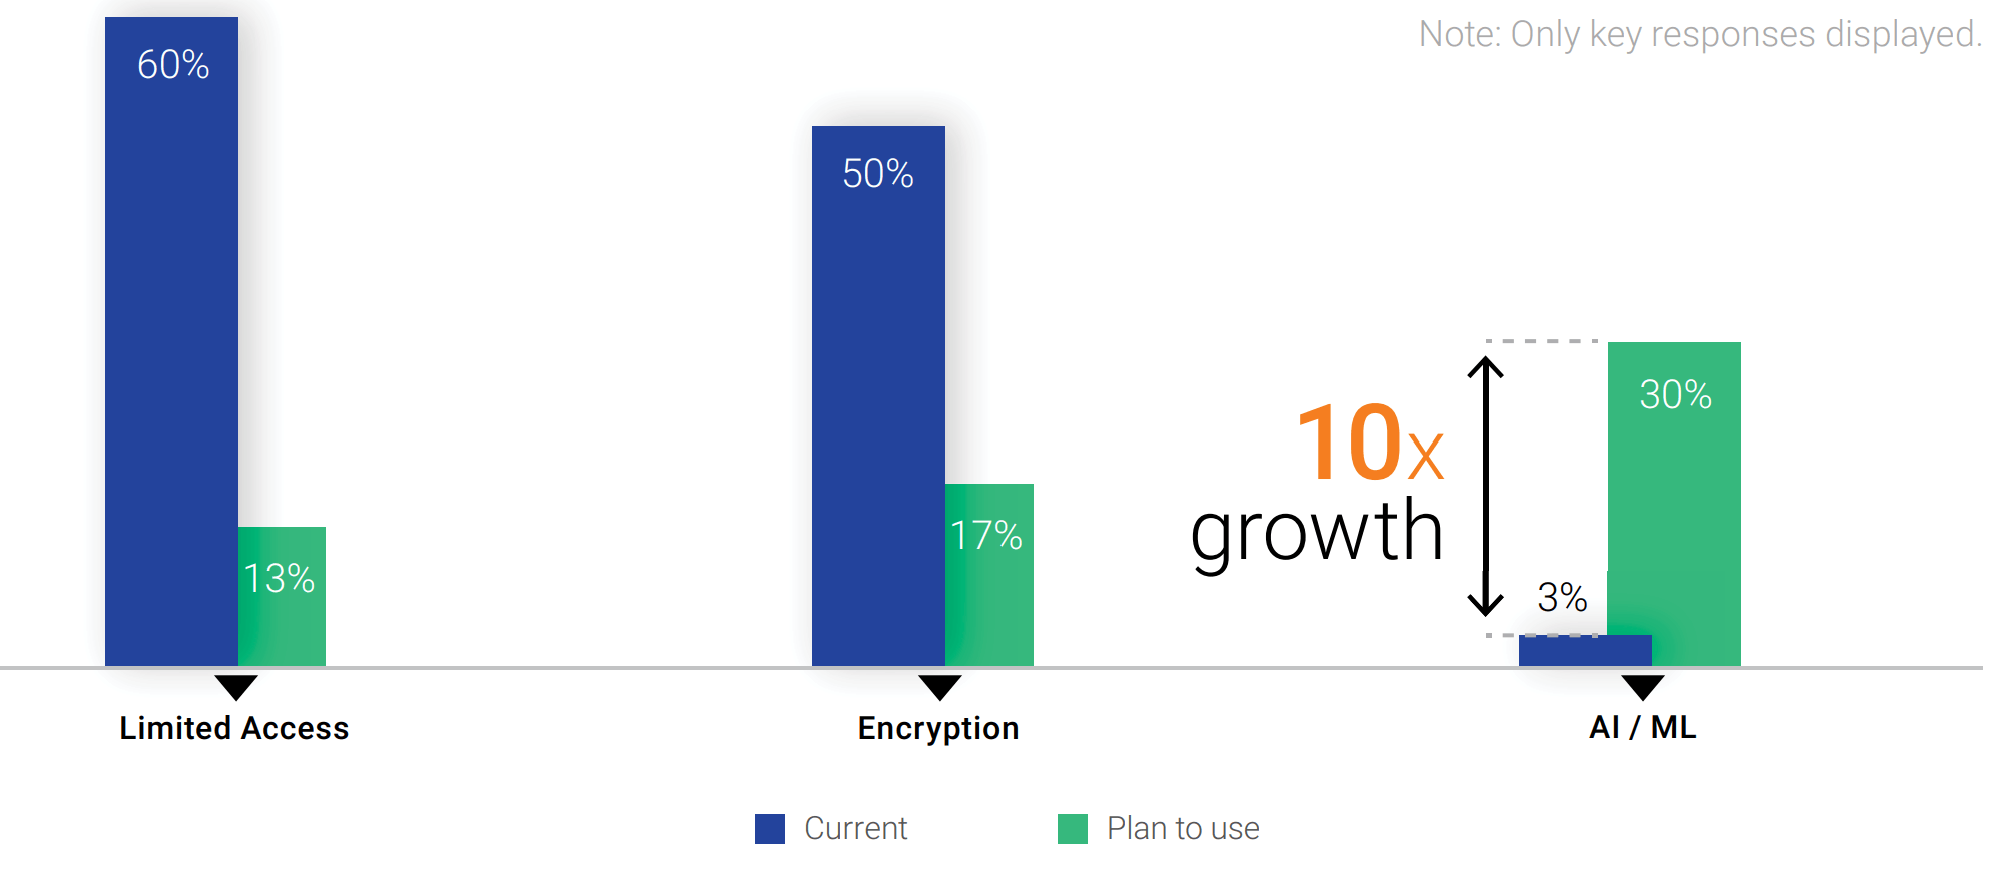
Limited access and encryption (all payment files) are the only two methods used by the majority of companies. Four other services sit between 30% and 47% adoption, and another 10-17% of firms expect to add to these services.
- Use of AI/ML to protect against payment fraud has a 30% “plan to use” response. This represents nearly double the rate of the next highest controls. Machine learning is highly effective at detecting patterns. This pattern detection can also spot anomalies — instances where a pattern isn’t consistent. Fraudulent items can often be detected based upon the “patterns” of changes, access, and frequency, and a user can review those items before payments leave the company
ADDITIONAL DISCUSSION:
- The principle of least privilege requires companies to restrict the access of users and credentials to only those areas/systems/data that are relevant. Then, if a credential is stolen or if an individual seeks to steal information or money, their ability to act or move around is greatly limited. This mitigates the amount of damage that can occur if one credential is compromised.
- Encryption of all payment files should make it more difficult to see and edit confidential banking information. The public/private key process also renders editing a file far more difficult, as the encryption/decryption process will alert the system or users of the error.
- AI/ML. Anomaly detection capabilities can be learned by an ML tool, and various rules for detection can also
be programmed in. When this is done, the user is alerted to anomalies that need to be reviewed by a human. The alerts can be informational only (and the payment continues unless stopped by the person), or they can be part of an interdiction (the payment stops unless and until a human reviews and approves the interdicted item).
7. Measurements: Financial Performance Wins Over SLA
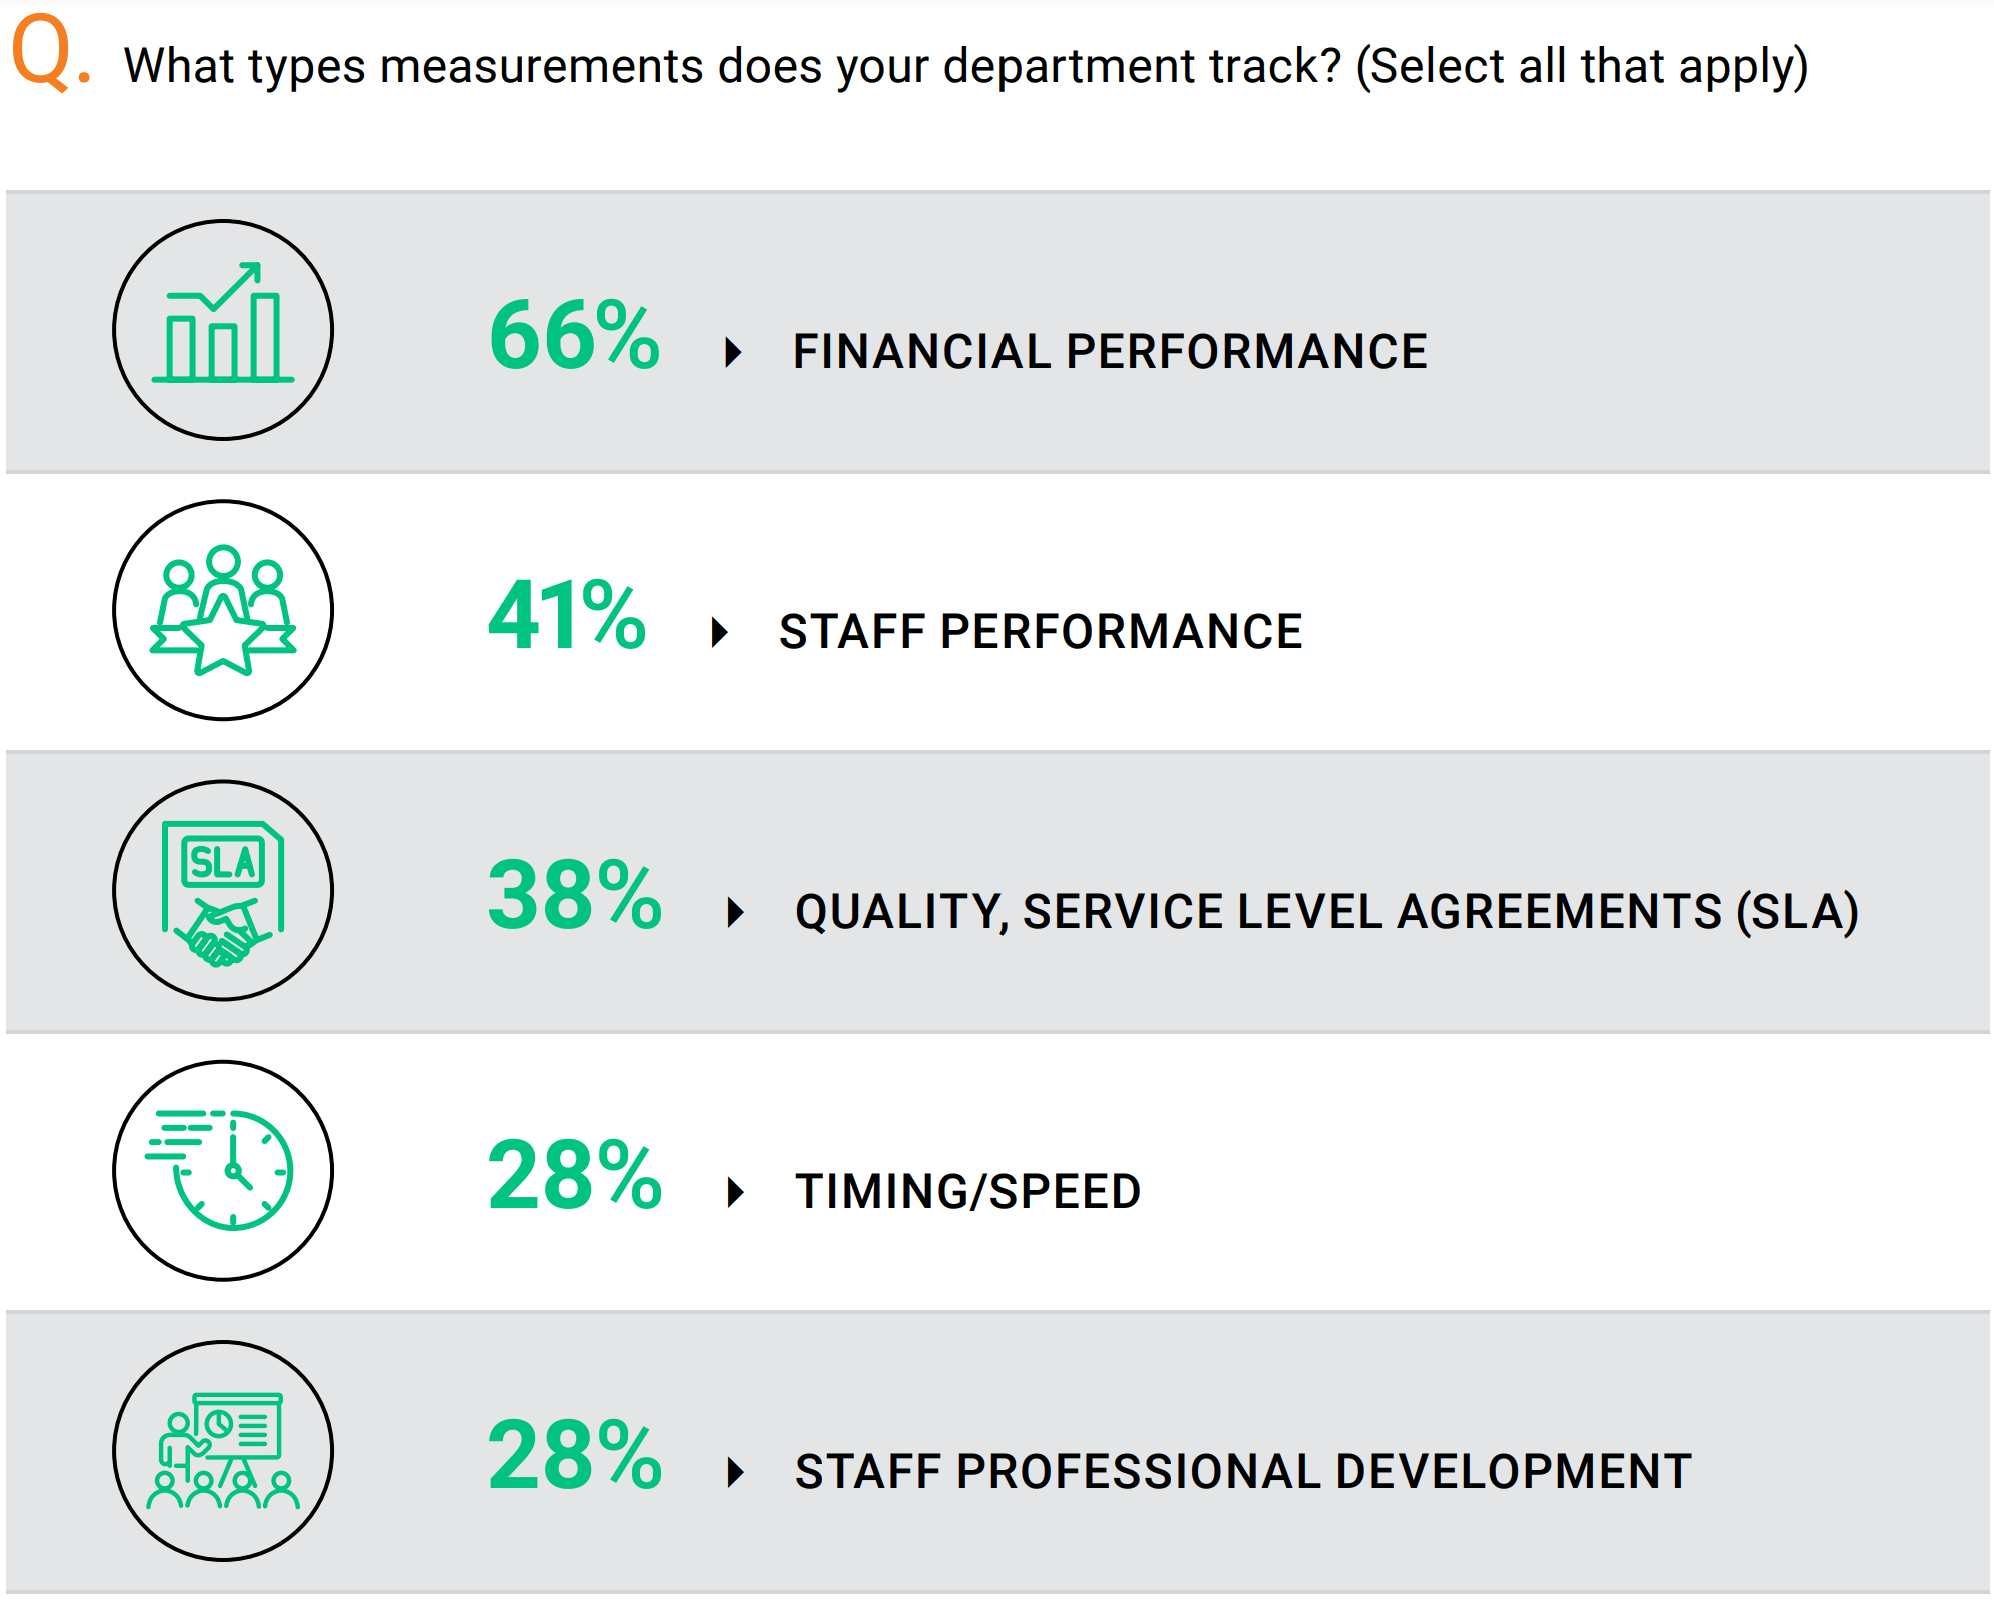
What gets measured, we are told, gets improved. What is being measured? Two-thirds of companies trace various financial performance metrics. Staff performance is a distant second at 41%, followed by quality-related performance measures (38%).
ADDITIONAL DISCUSSION:
- It is not surprising that in finance areas, measuring financial performance takes the top spot in this survey.
- However, why do not even 3 out of 10 companies measure staff professional development if people are the most valuable asset?
- Is there little correlation between staff development and success?
- Is it related to the fact that measuring staff development is highly challenging?
- What is the benchmark?
8. Benchmarks — Personal Best
What do companies want to improve? It may be that they are measuring what is most important to them. It may be that more companies measure what they can most easily get measurement data for. Most companies track their current performance against their own historical numbers, while some performed external benchmarking.
- 62% measure themselves against themselves.
- The external benchmarks are as follows:
− 41% measure themselves against similar companies (similar industry verticals).
− 24% measure against companies of about the same size
ADDITIONAL DISCUSSION:
- Company complexity has a variety of dimensions. The most common factors companies think about for comparable numbers are 1) revenue/sales and 2) industry vertical.
- Other factors of complexity include 1) number of systems in use, 2) how many countries the organization operates in, and 3) the number of underlying processing systems.
- Benchmarks are used for a variety of reasons, including:
− Staff size/resources
− Efficiency purposes
− Confirmation as to the position of the company via leading practices
− Progress over time against their own performance and others in their “peer group”
9. Collateral Management: The Most Common Manager Is…Treasury
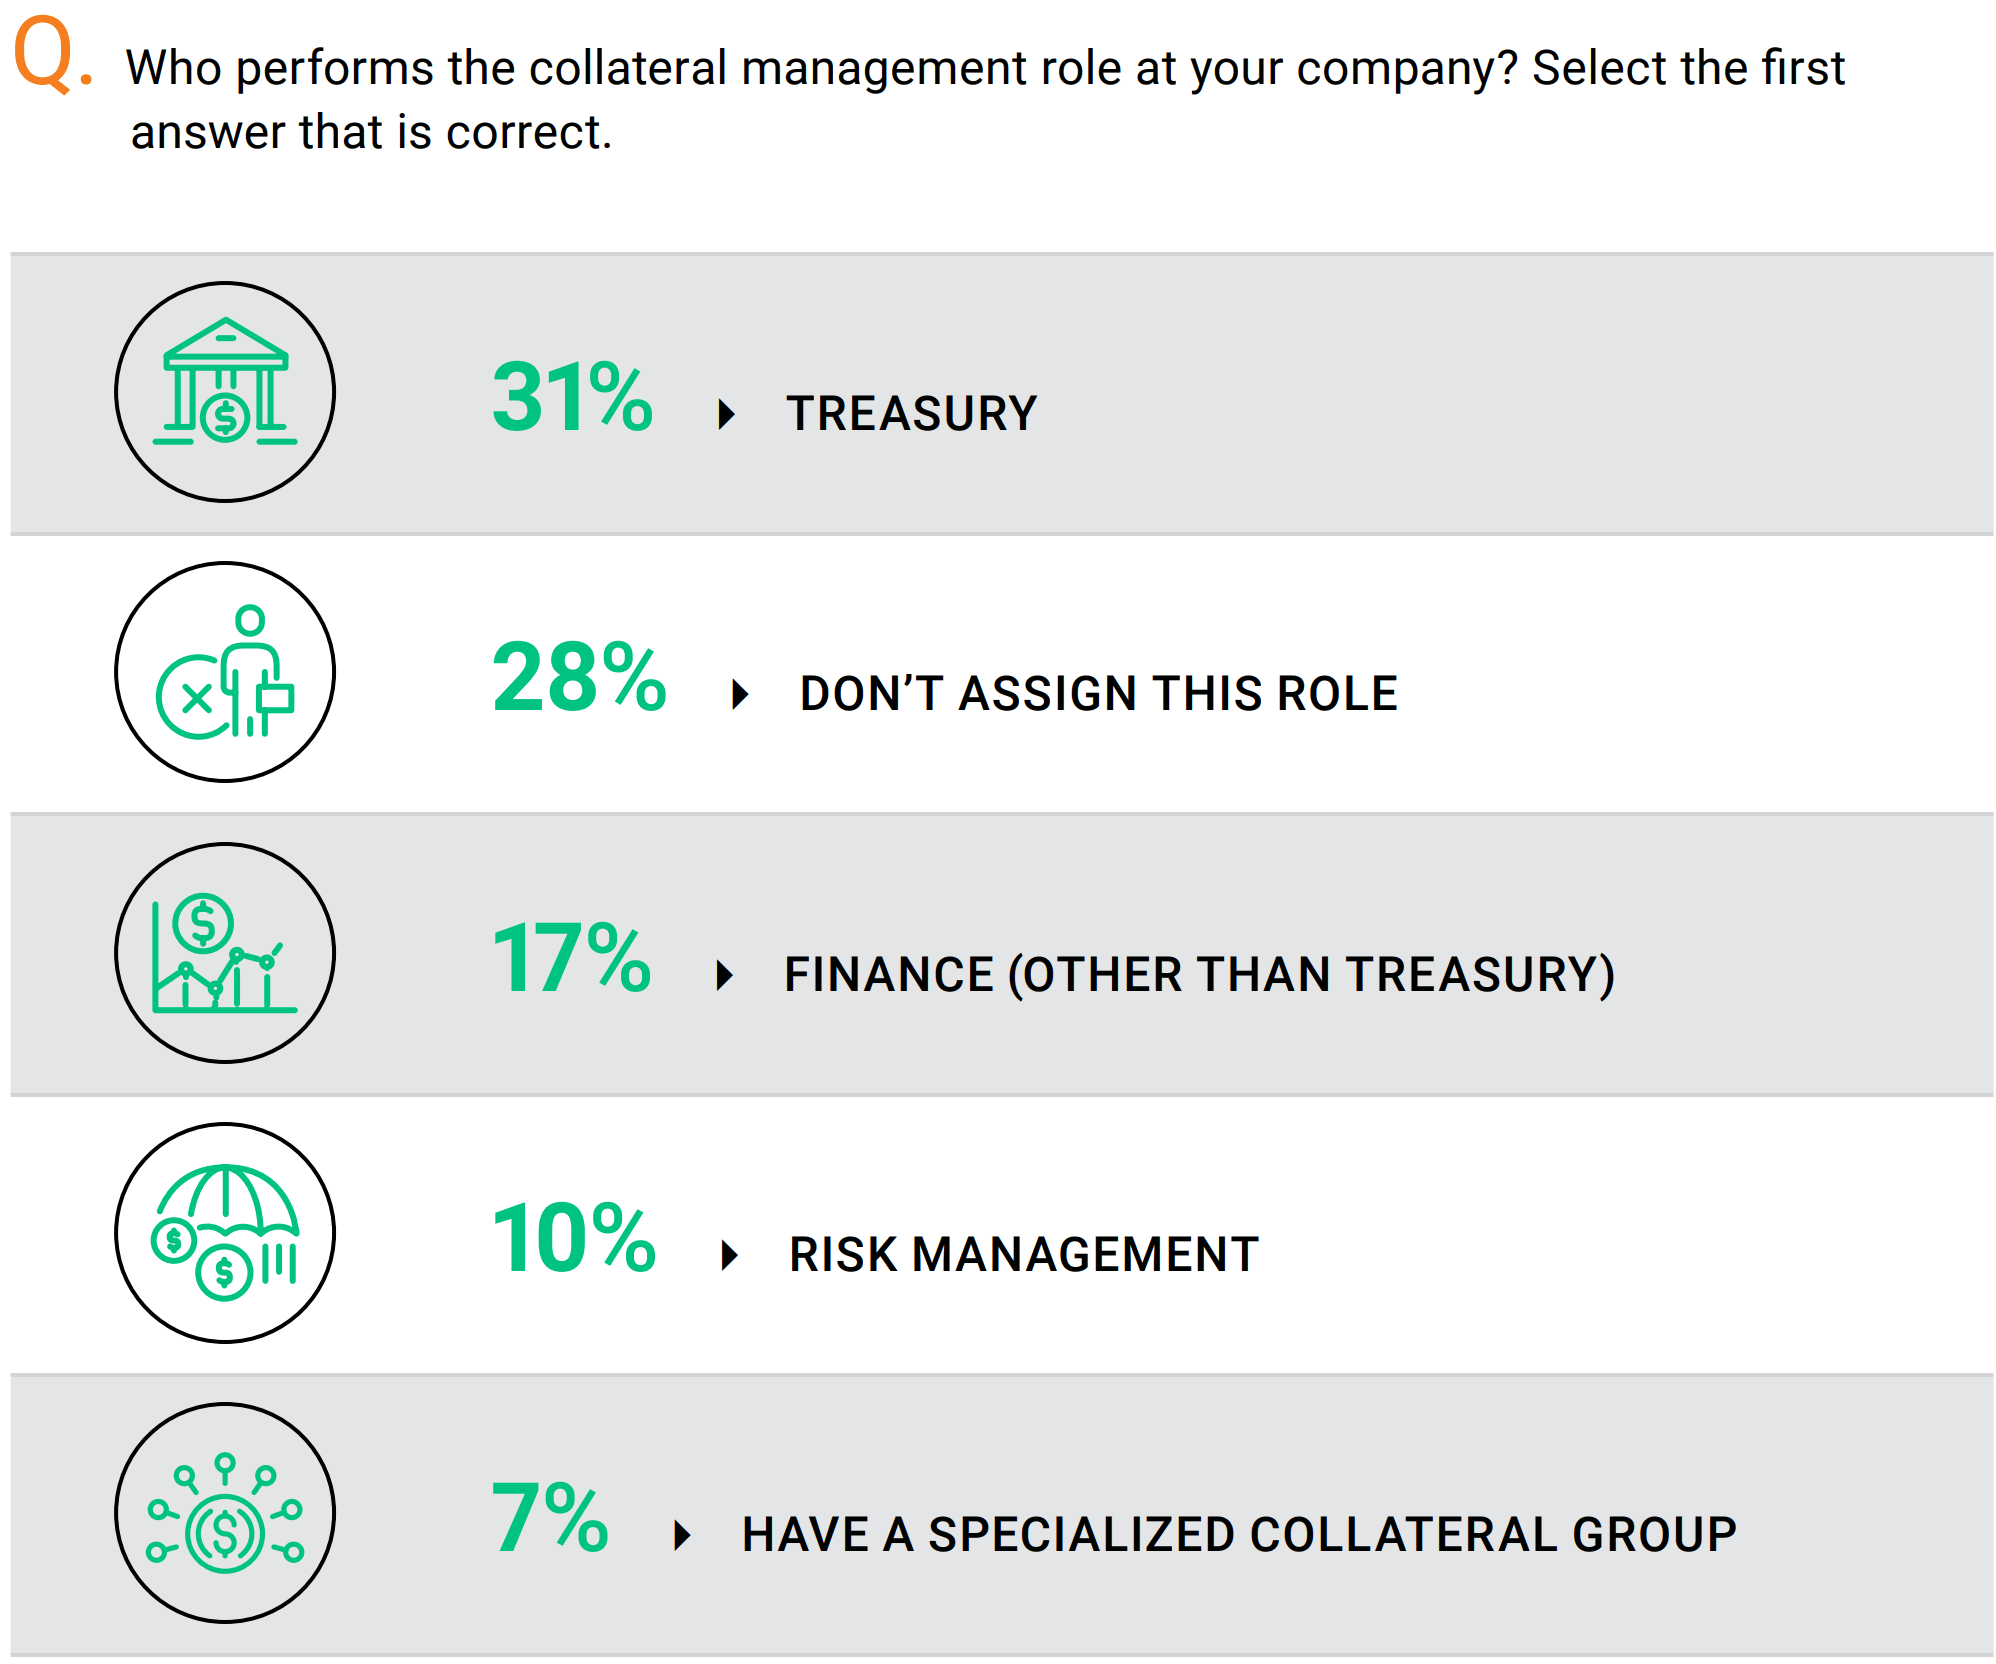
Collateral management is a risk related function that supports the operational and investment activities of many NBFIs. Treasury is the department that is most frequently responsible for managing collateral (31% of firms). More than one-fourth of firms don’t assign this role.
10. Collateral Management’s Impact on Cash Positioning: Tracked Separately.
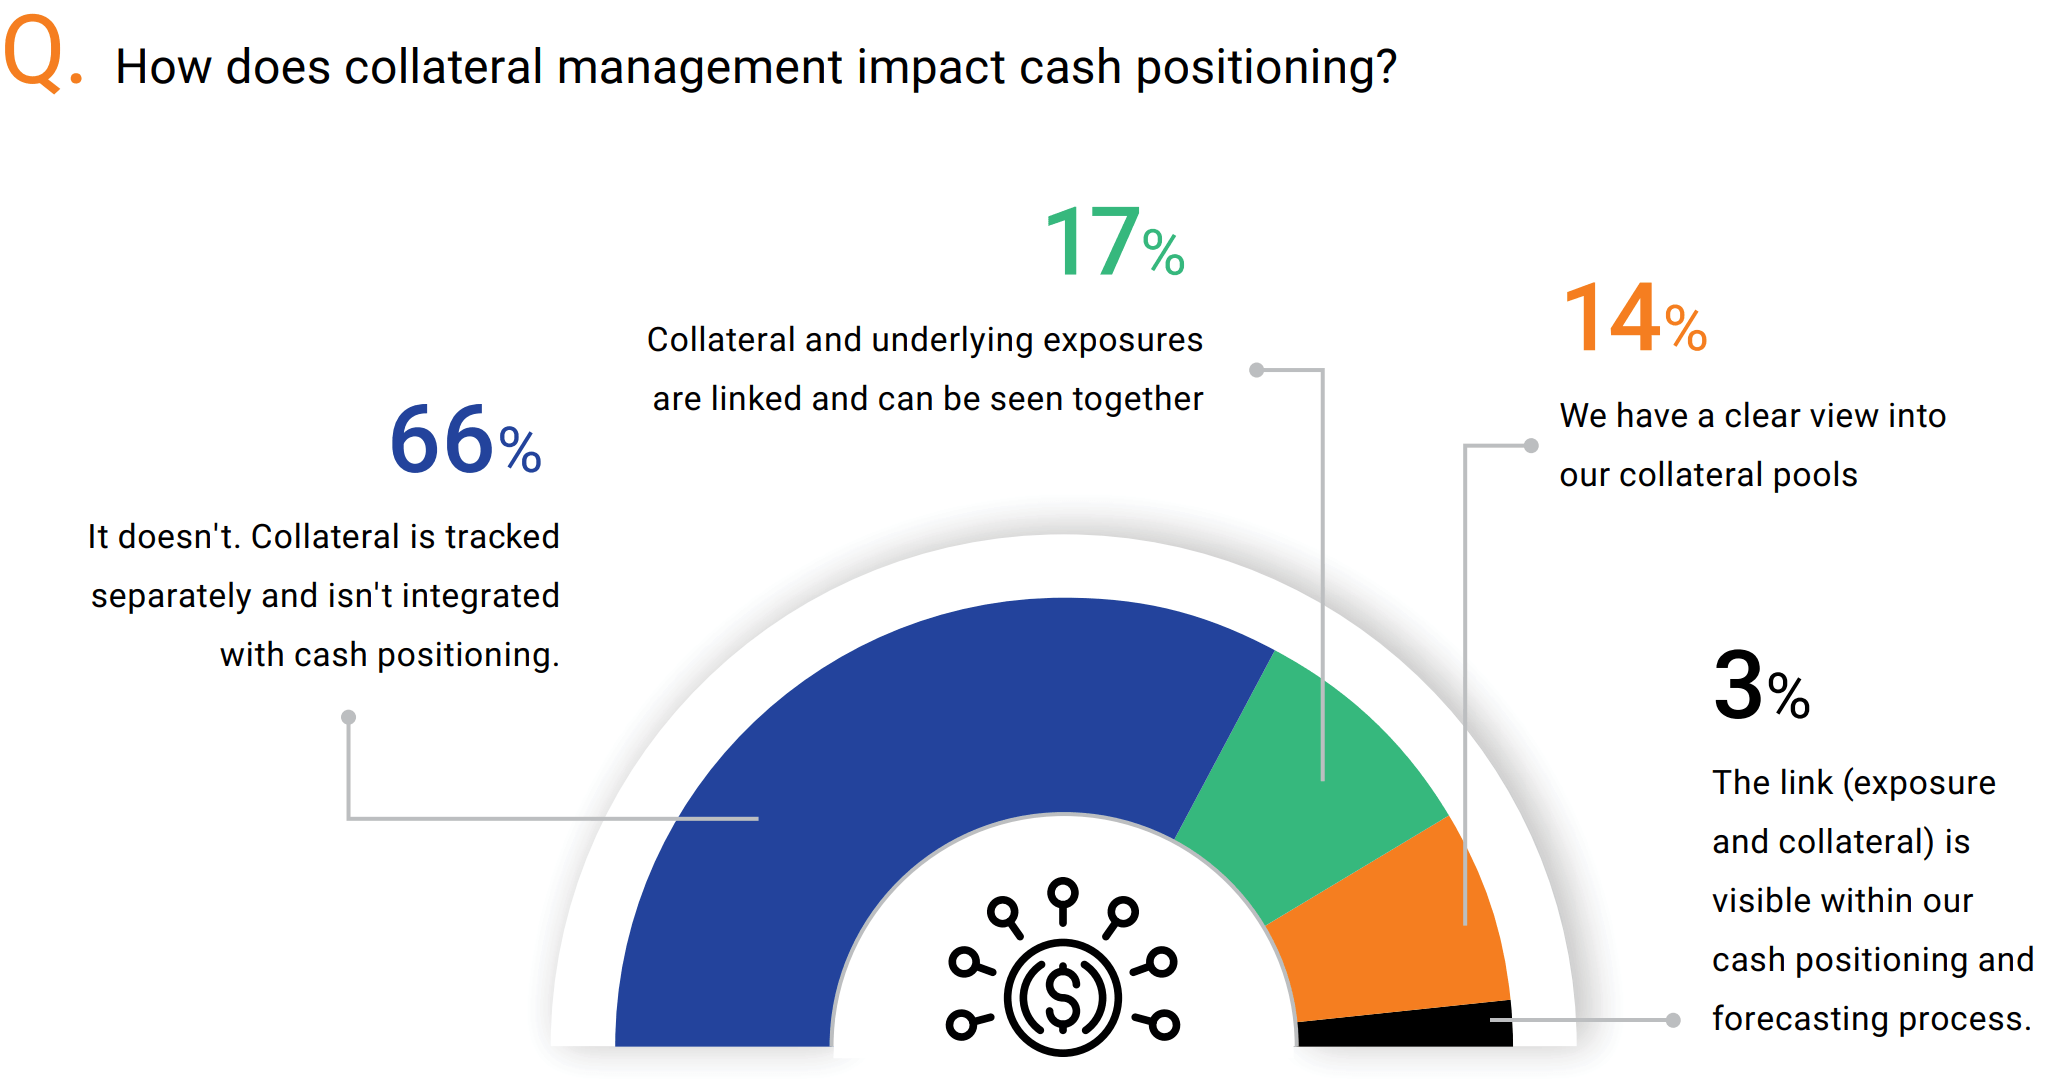
Collateral management within NBFIs appears to be relatively immature (non-integrated).
- Just over a third (34%) indicated that they have visibility or links to the collateral and underlying exposures.
− Collateral and exposures can be seen together: 17%.
− Clear view into collateral pools: 14%.
− Can see the exposure and collateral within the cash positioning and forecasting process: 3%. - Most firms (66%) track collateral and cash positioning in separate channels with no cohesive or unified view.
ADDITIONAL DISCUSSION:
- The practice of collateral management appears to be, on average, somewhat informal for many NBFIs, as can be observed from the following data points:
− 28% of companies don’t have collateral management assigned to a particular area.
− 66% lack a unified view of collateral or track it in a separate channel than their cash positioning activity
Silicon Valley Bank’s collapse is a warning for all finance leaders. Check out this on-demand webinar and hear Kyriba’s top treasury and payments experts discuss the collapse, subsequent fallout, and how your organization can mitigate risk with improved liquidity planning.
