This paper examines best practices for how to diagnose your Enterprise Liquidity Management (ELM) processes, both qualitatively and quantitatively, to determine what you are doing well, what you need to improve, and how to drive additional value for your organization. To objectively assess where you stand, where you need to go, and how to get from here to there, liquidity benchmarking is a perfect weapon for you.
How often have you wondered about how your organization is truly performing in comparison to your competitors? “What would it take to identify the best practices leading organizations in your industry have adopted?”, or “Do we know what changes are required for a transformation initiative or a technology investment?” If you have asked yourself these questions, answering them can be difficult. Although these are critical questions, many organizations take shortcuts and bypass them thinking they have sufficient information to implement change. Alternatively, some companies opt for contracting with a third-party to perform such assessments to determine what process and technology changes are required to achieve a desired business outcome. These engagements are, however, not cheap and can be very theoretical, especially when it comes to treasury and ELM practices. There is little in terms of detailed financial metrics and codified best practices available in the marketplace.
ELM, as an organization function, is in its infancy. Ownership of its key operating processes has typically been split amongst many stakeholders with sometimes conflicting interests. It is, however, a critical enterprise function. One of the key performance indicators of any for-profit enterprise is its ability to generate cash. Gaining control of sources and uses of cash and strategies to maximize those are what encompasses the discipline of ELM (ELM). In Finance speak, ELM crosses several finance business processes: Cash & Liquidity, Payments, Risk Management, and Working Capital Management. It is the multidisciplinary nature of the discipline that has made it difficult to garner holistic and historical data and best practices about underlying processes.
What is ELM Benchmarking and Why Does it Matter so Much?
Finance can benefit from leveraging benchmarking to evaluate and then improve financial performance and competitive advantage. Effective and optimal benchmarking comes from having the ability to use large and diverse data sets giving finance organizations a better understanding of both historical performance and industry trends and rankings. Questions such as “How has my organization performed over the past years?” “Is performance truly improving?” or “How are we doing against our industry peers?” are paramount to objectively assessing both success and improvement opportunities.
Furthermore, a more dynamic view of historical data and benchmarking against the right peer group has a significant added benefit: identify best practices that need to be established or emulated. Finance professionals have long used financial benchmarks such as the S&P 500 or Dow Jones indexes to see how they are doing. Many have also compared themselves to key competitors against specific financial metrics such as Revenue Growth, Profit Margins, EBITDA, DSO (Days Sales Outstanding), and EPS. Many have also evaluated their current performance against historical benchmarks.
What few have done is truly gone one level below and pinpoint the root cause of their performance. In other words, they have used lagging indicators to determine the “What” of performance. Too few have taken the next logical step of establishing and comparing their performance against leading indicators. The role of leading performance indicators is to answer the “Why” question. What is objectively causing performance to be what it is? What could be inferred in terms of remedial action to further drive results?
Having both views, lagging and leading indicators, along with statistically relevant performance data samples are the secret to sustainable financial performance improvement. Comparative data with statistically significant historical data spanning operating geographies, industries, and sectors, and based on entity sizes add even more insights to drive business improvement decisions to the next level.
ELM Benchmarking Relevance for Finance Organizations
Finance organizations typically focus their benchmarking efforts on lagging indicators. One of the best practices many organizations follow is the use of both historical performance and peer group comparisons.
Historic & Lagging Indicators: Historical benchmarks can be very insightful in seeing how an organization is performing over time. Has the company’s revenue growth, profit margin and net income increased or decreased compared to the past few quarters or years. Having this type of financial information can inform key decision makers to undertake strategic initiatives. They will typically start with an observation and try to hypothesize on what needs to be done to drive further improvements. This type of approach, albeit common in many companies, relies heavily on tribal knowledge and expertise drawn from either past observation or emulating competitors’ behaviors, real or ascertained.
Leading Indicators: There are two missing links, not one. The first is the ability to tap into and leverage leading indicators to understand what a business process is capable of, and, why performance levels excel or lag. The second, and most difficult to achieve, is to leverage statistically significant and comprehensive sample data to aid in the decision-making process. Kyriba’s Value Engineering team has been hard at work for the past five years to build such a Benchmarking database with both leading and lagging performance indicators. The database currently has 1,600+ organizations that can be segmented by revenue, industry, geography, and business process.
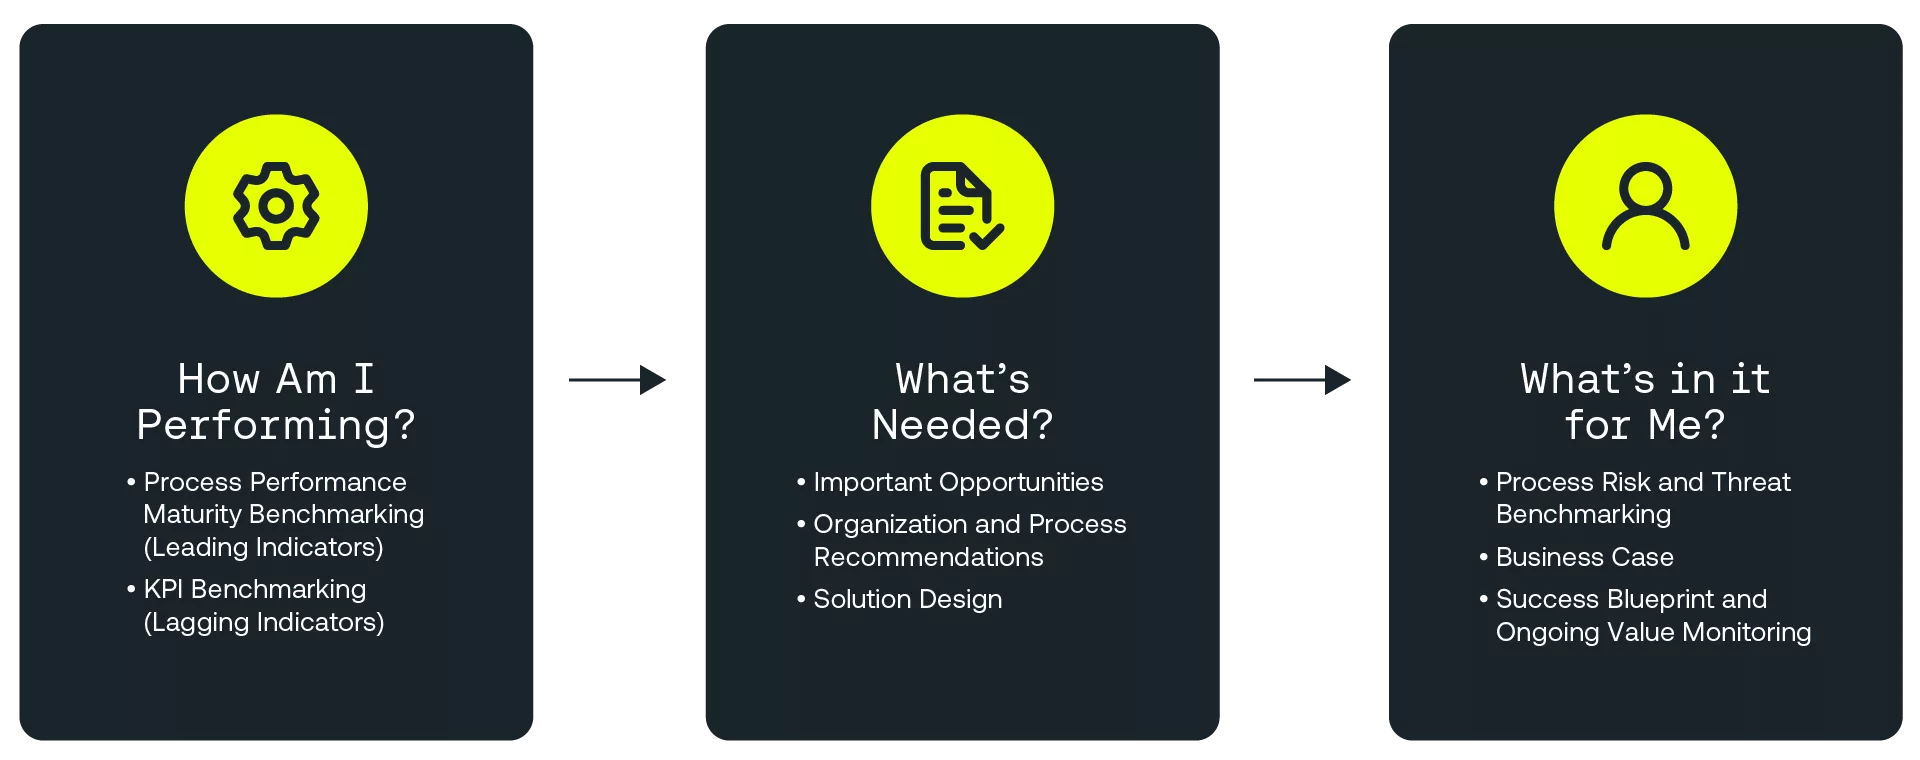
Let’s assume your organization is embarking on a digital transformation of its finance and treasury management processes. Furthermore, it knows it needs to start right away, but has not yet done all the due diligence to identify where to start, the sequence of change, or the benefit it could realistically expect to achieve. The Kyriba Value Engineering team would collaborate with your organization to identify what’s working well and what needs to be improved upon, as well as the prioritization of the steps based on objective criteria.
Benchmarking Your ELM Processes
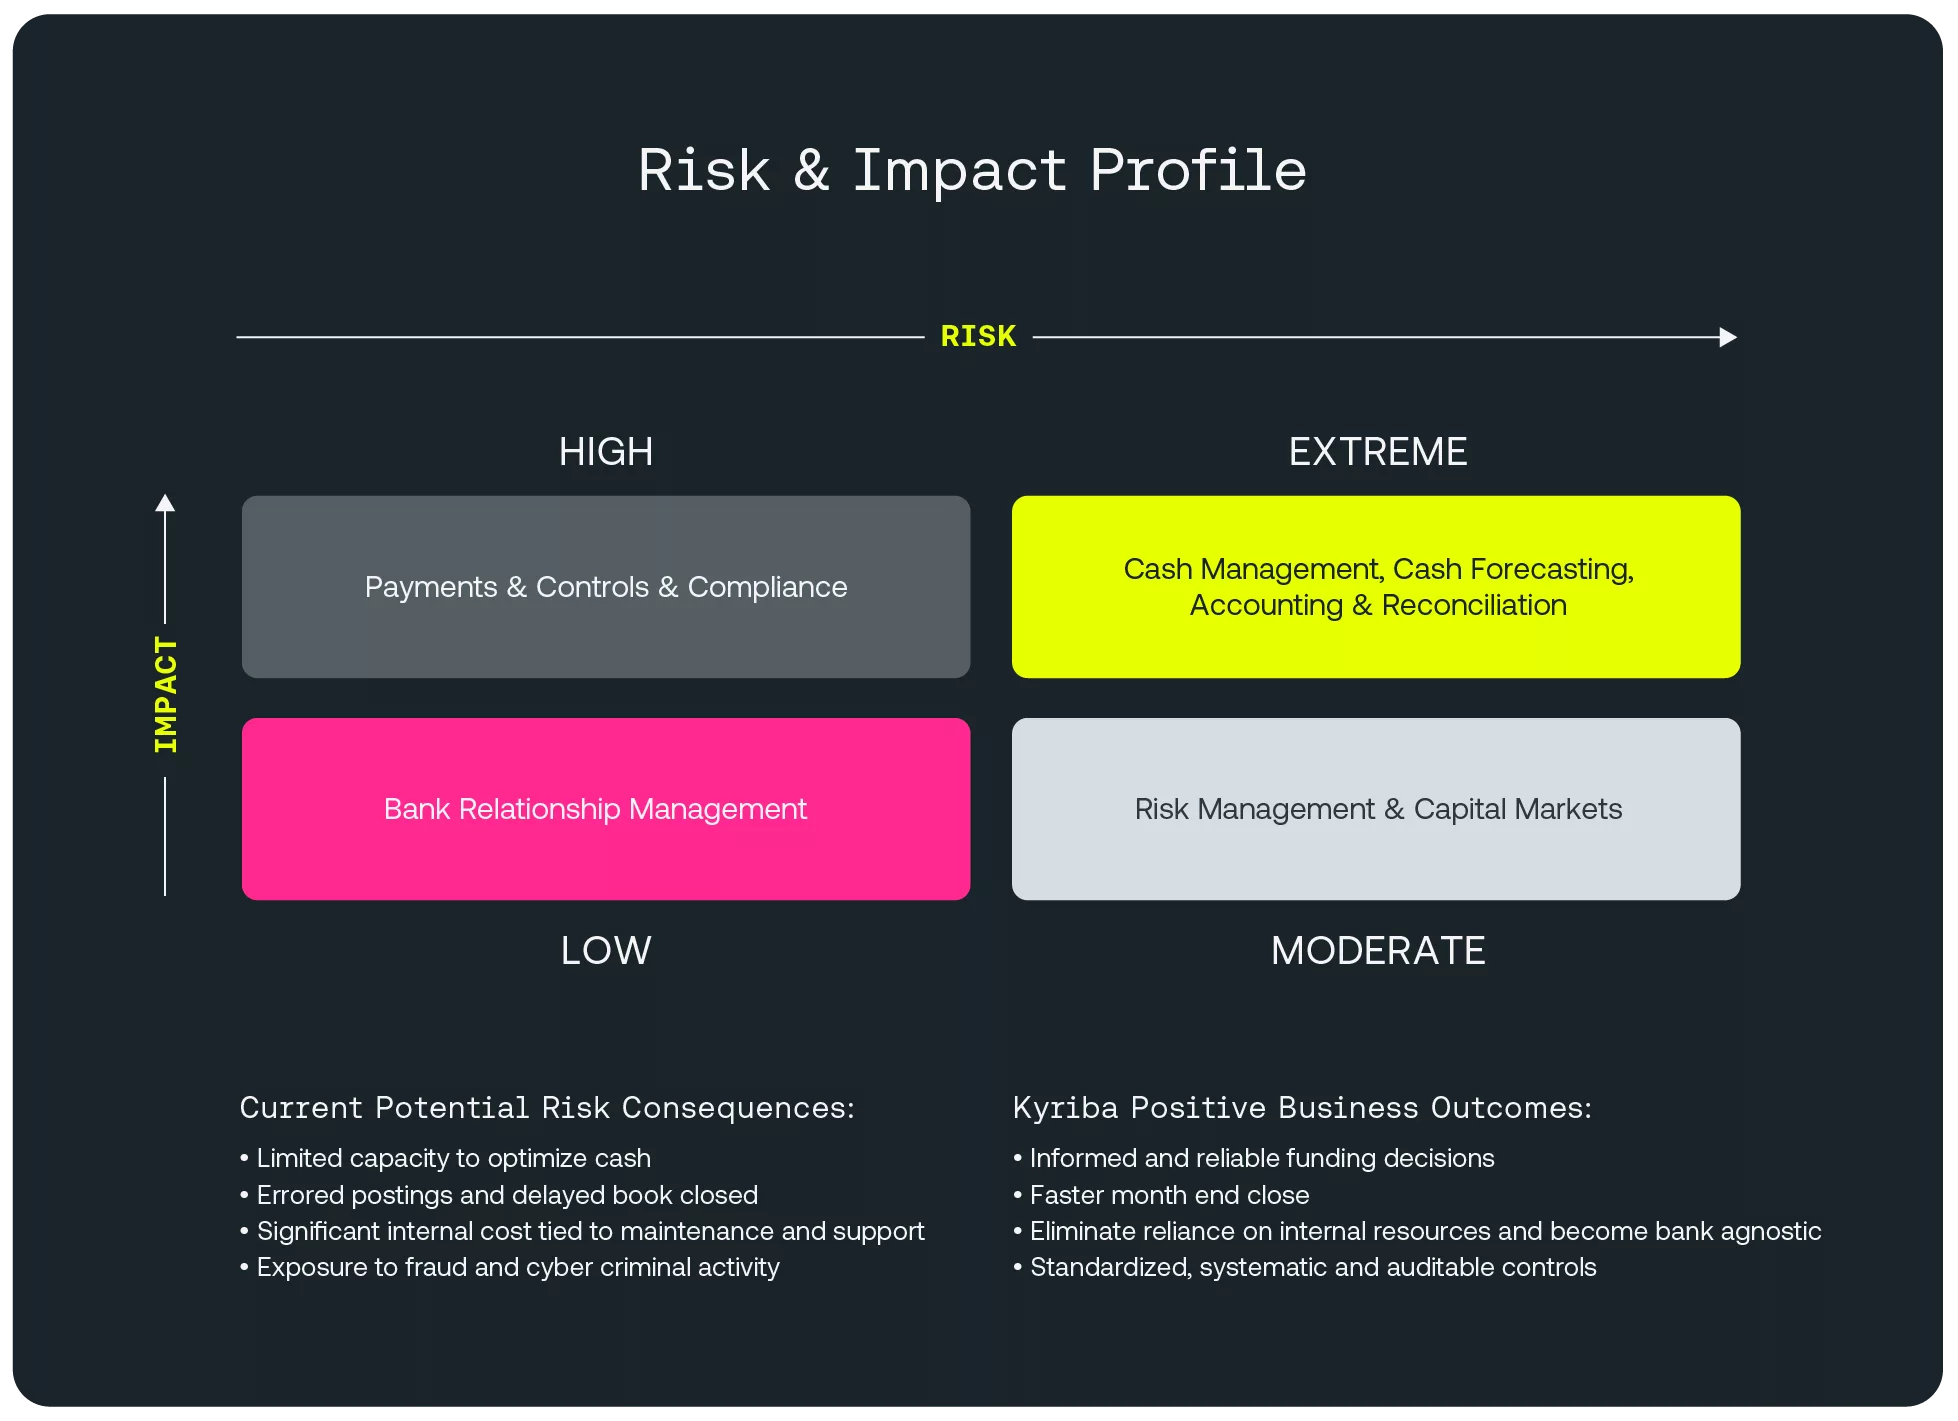
ELM is one of the most critical areas for any organization. It spans Cash & Liquidity Management, Capital Markets & Risk Management, Payments & Fraud, and Working Capital, all of which are paramount to organizational vitality. As such, and given the mounting uncertainty, rising inflation, global pandemics, and geo-political instability, it should be benchmarked regularly. Initiating a comprehensive and rigorous liquidity benchmarking would not only help to identify internal gaps, but also, help an organization garner and adopt industry best practices to weather the storm and even thrive. We believe that enabling organizations to objectively take necessary steps to benchmark their performance would improve organizational resilience and boost efforts to drive enhanced competitiveness and value creation.
Gathering the required information from scratch can be a monumental task, especially if there is no benchmarking foundation, established methodologies, long data history and peer comparison groups across both leading and lagging indicators.
The dilemma many organizations face is acknowledging the importance of the insights that can be derived from benchmarking yet recognizing the daunting task of building a practice by themselves. This often leads to deferring benchmarking initiatives. To overcome this challenge, organizations partner with liquidity management and industry experts/advisors to perform this critical strategic step.
Here at Kyriba, we made the decision five years ago to build performance benchmarking to support our clients and prospective customers need to assess themselves against peer groups to determine 1- what’s working well, and 2- what needs to be improved upon.
The Kyriba liquidity benchmarking database has 1,600 organizations across multiple industries, sectors, revenue sizes and geographies, making it the largest ELM benchmarking repository in the world. The database is also growing at 500 to 600 per year.
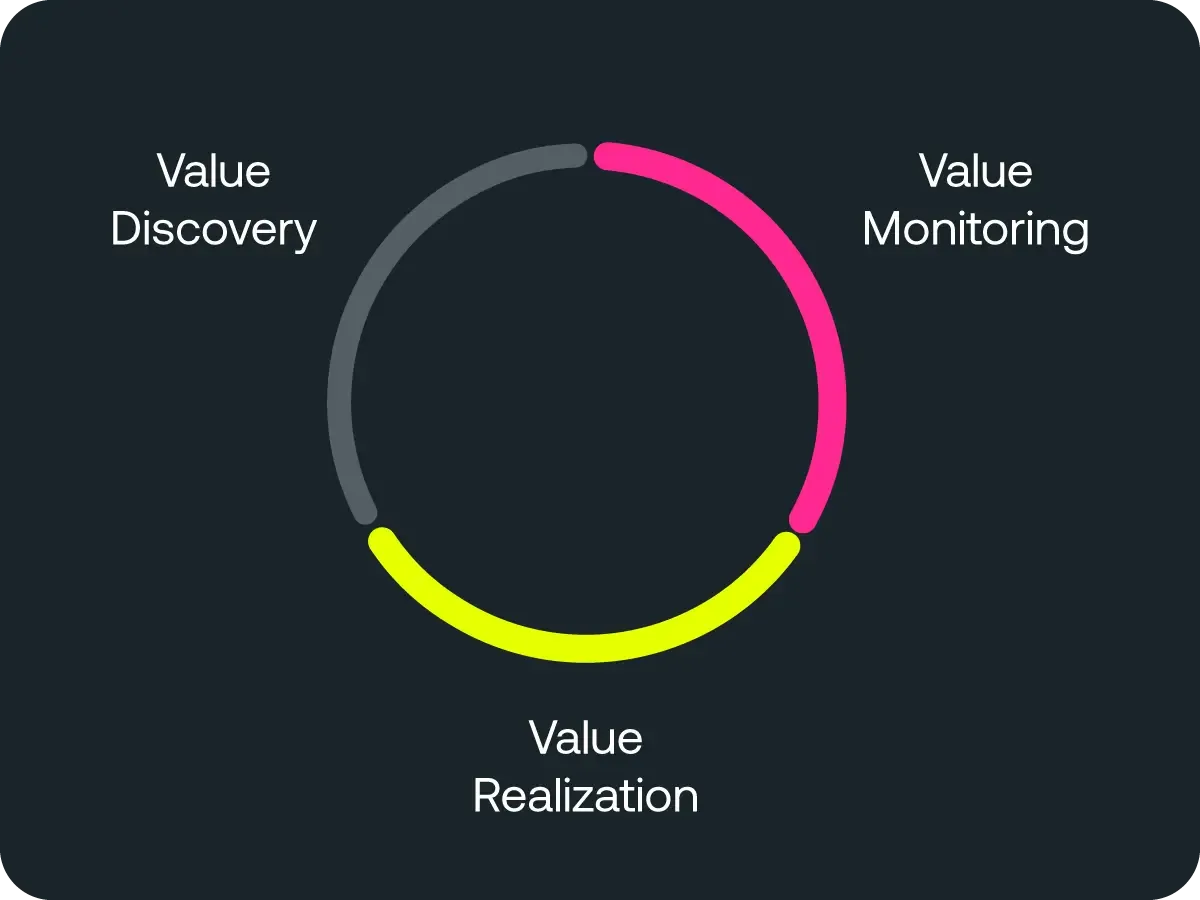
With the only dedicated practice around ELM benchmarking, Kyriba uses finance and treasury practitioners and executives to conduct client assessments. Furthermore, to streamline the process and make it efficient, the Kyriba Value Engineering Team uses collaboration tools to collect, validate and refine the data it collects from clients. Client organizations are critical to the success of the program. The Kyriba team collaborates with our clients to identify the right improvement opportunities they need to pursue based on factual empirical data. We use our benchmarking findings as a blueprint for value creation, monitoring, and realization. This full value lifecycle approach allows clients and Kyriba to forge a value-based, outcome-focused partnership.
The Kyriba Value Engineering team has recruited the best in the business. Each Value Engineer has over 15 years of field, treasury and finance experience, and hundreds of assessments under her/his belt, and are relentlessly focuses on client satisfaction. Each Value Engineer will collaborate with your team to create the compelling case you need to secure the required investment to support your treasury transformation.
See Where Your Organization Stands
Compared to Industry Leaders